The Indianapolis metro area enrolled roughly the same number of students in 2025-26 as it did a decade ago. Almost none of them are in the same place.
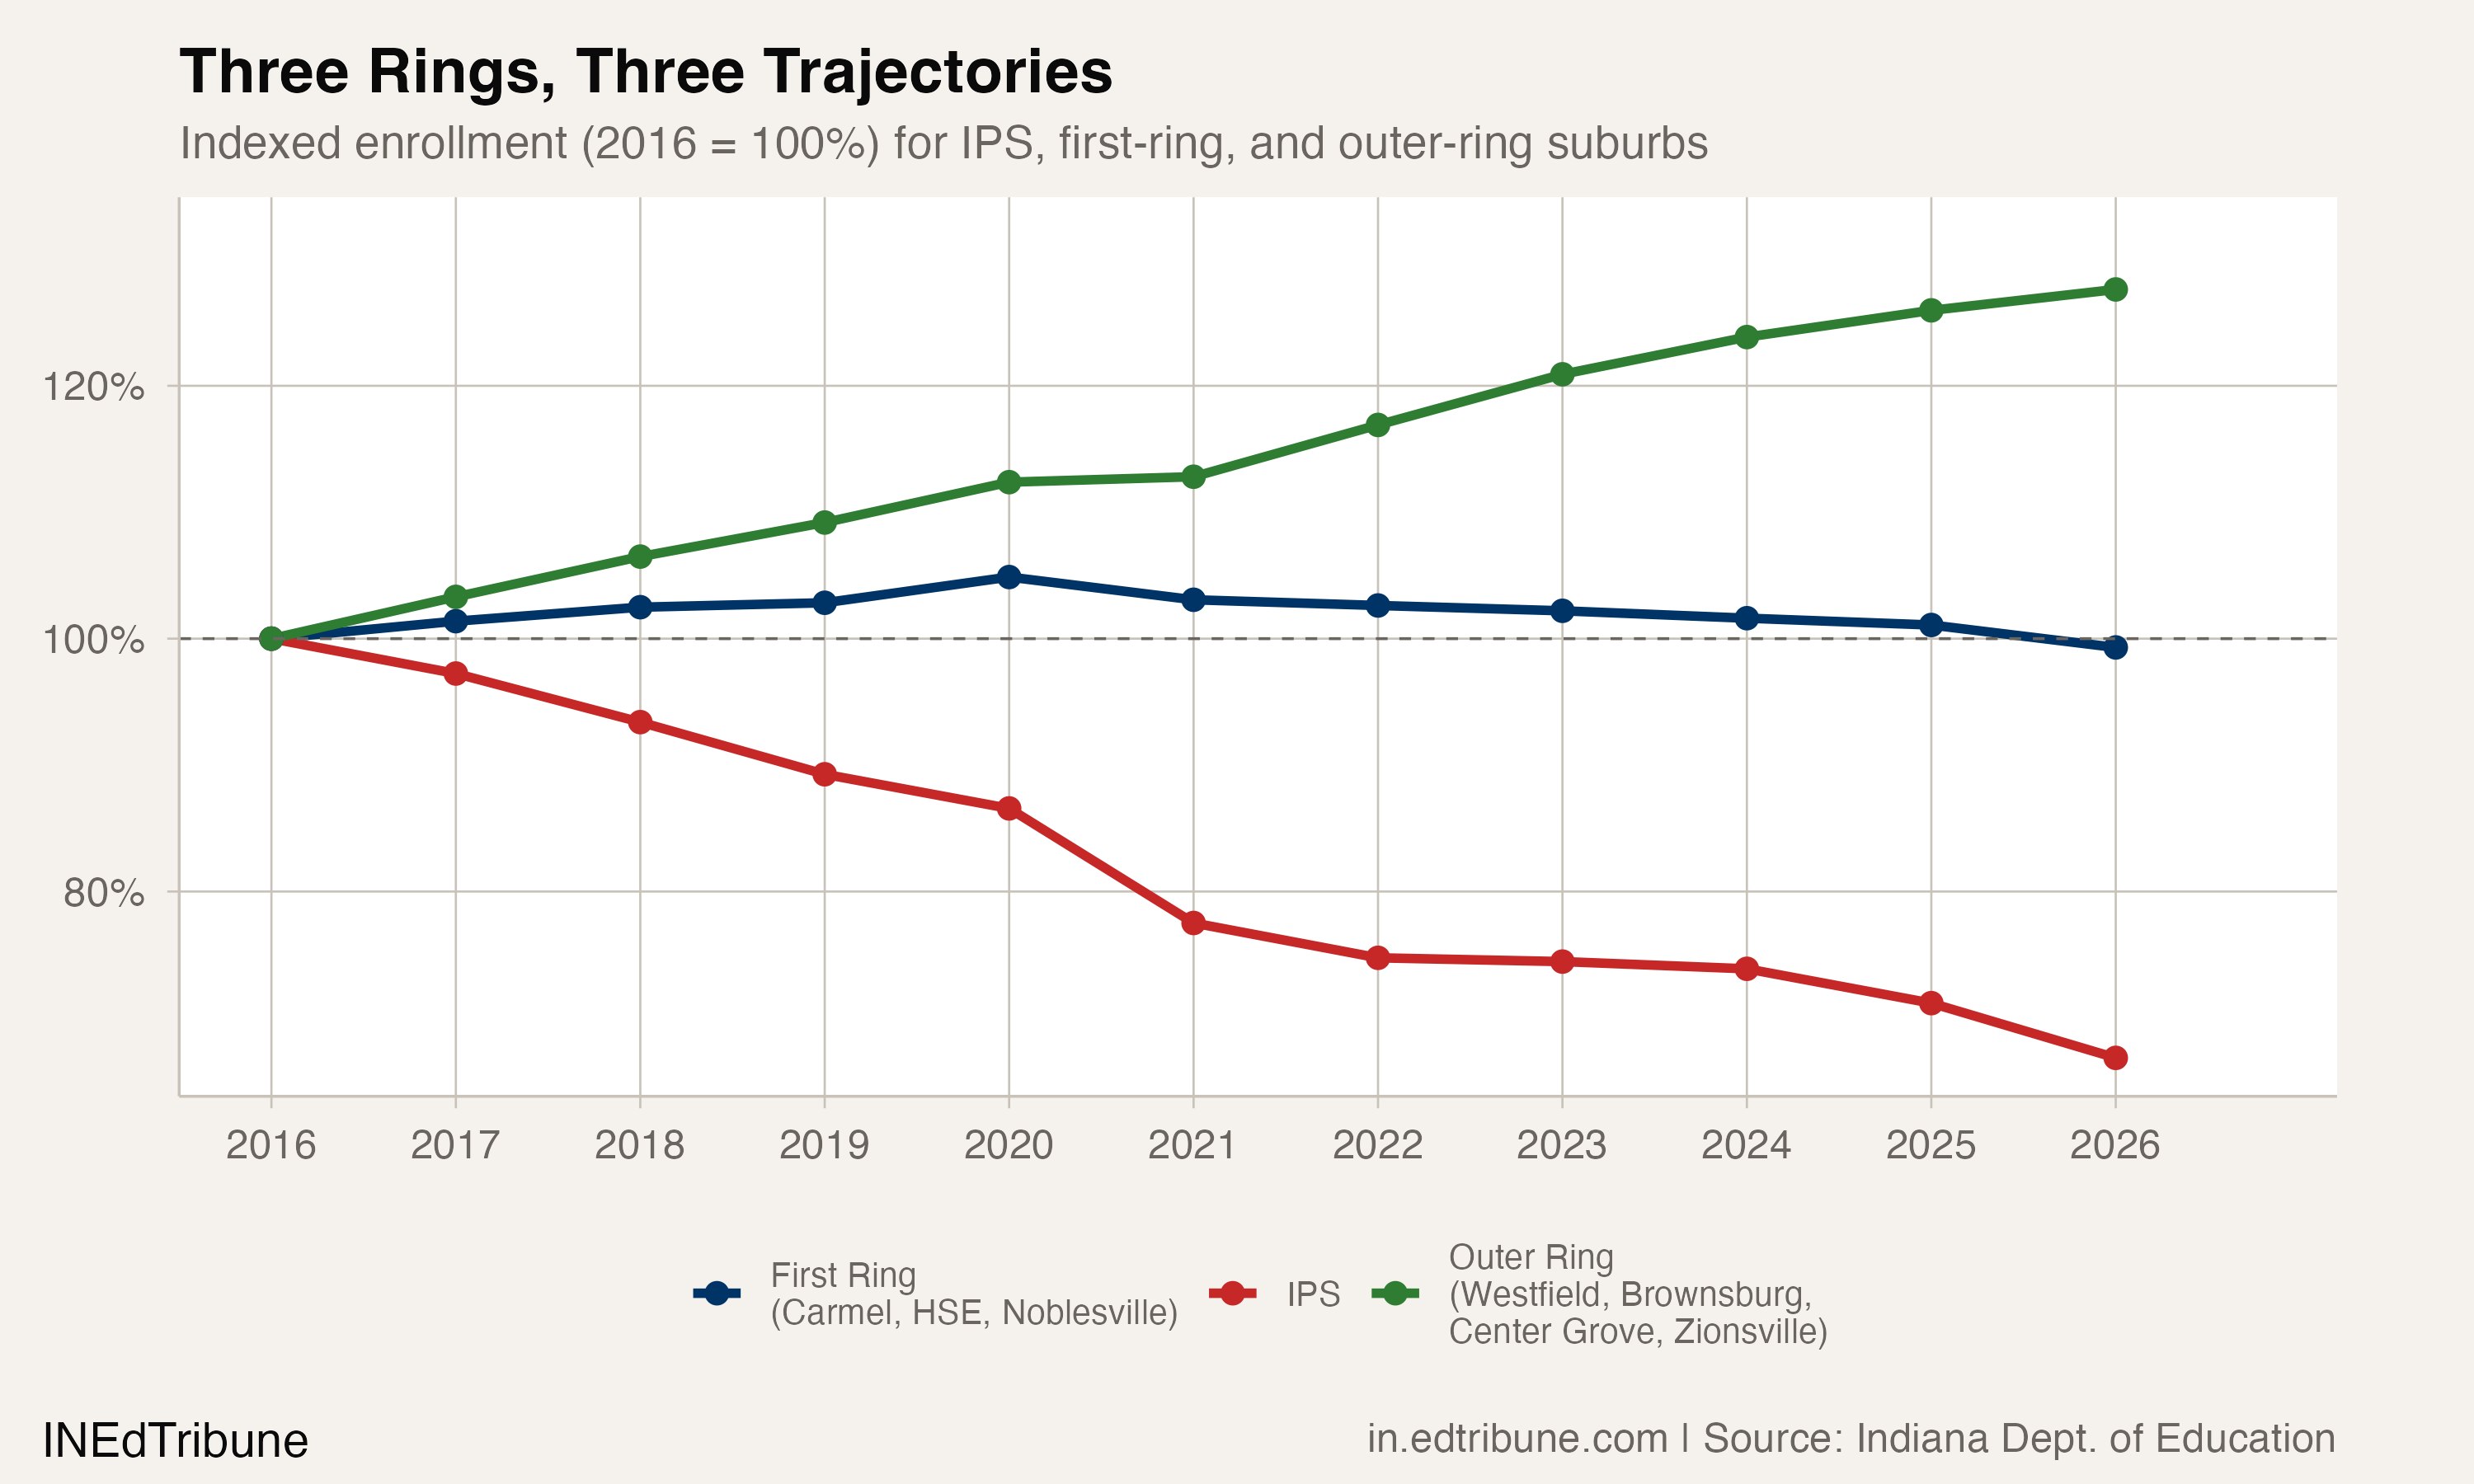
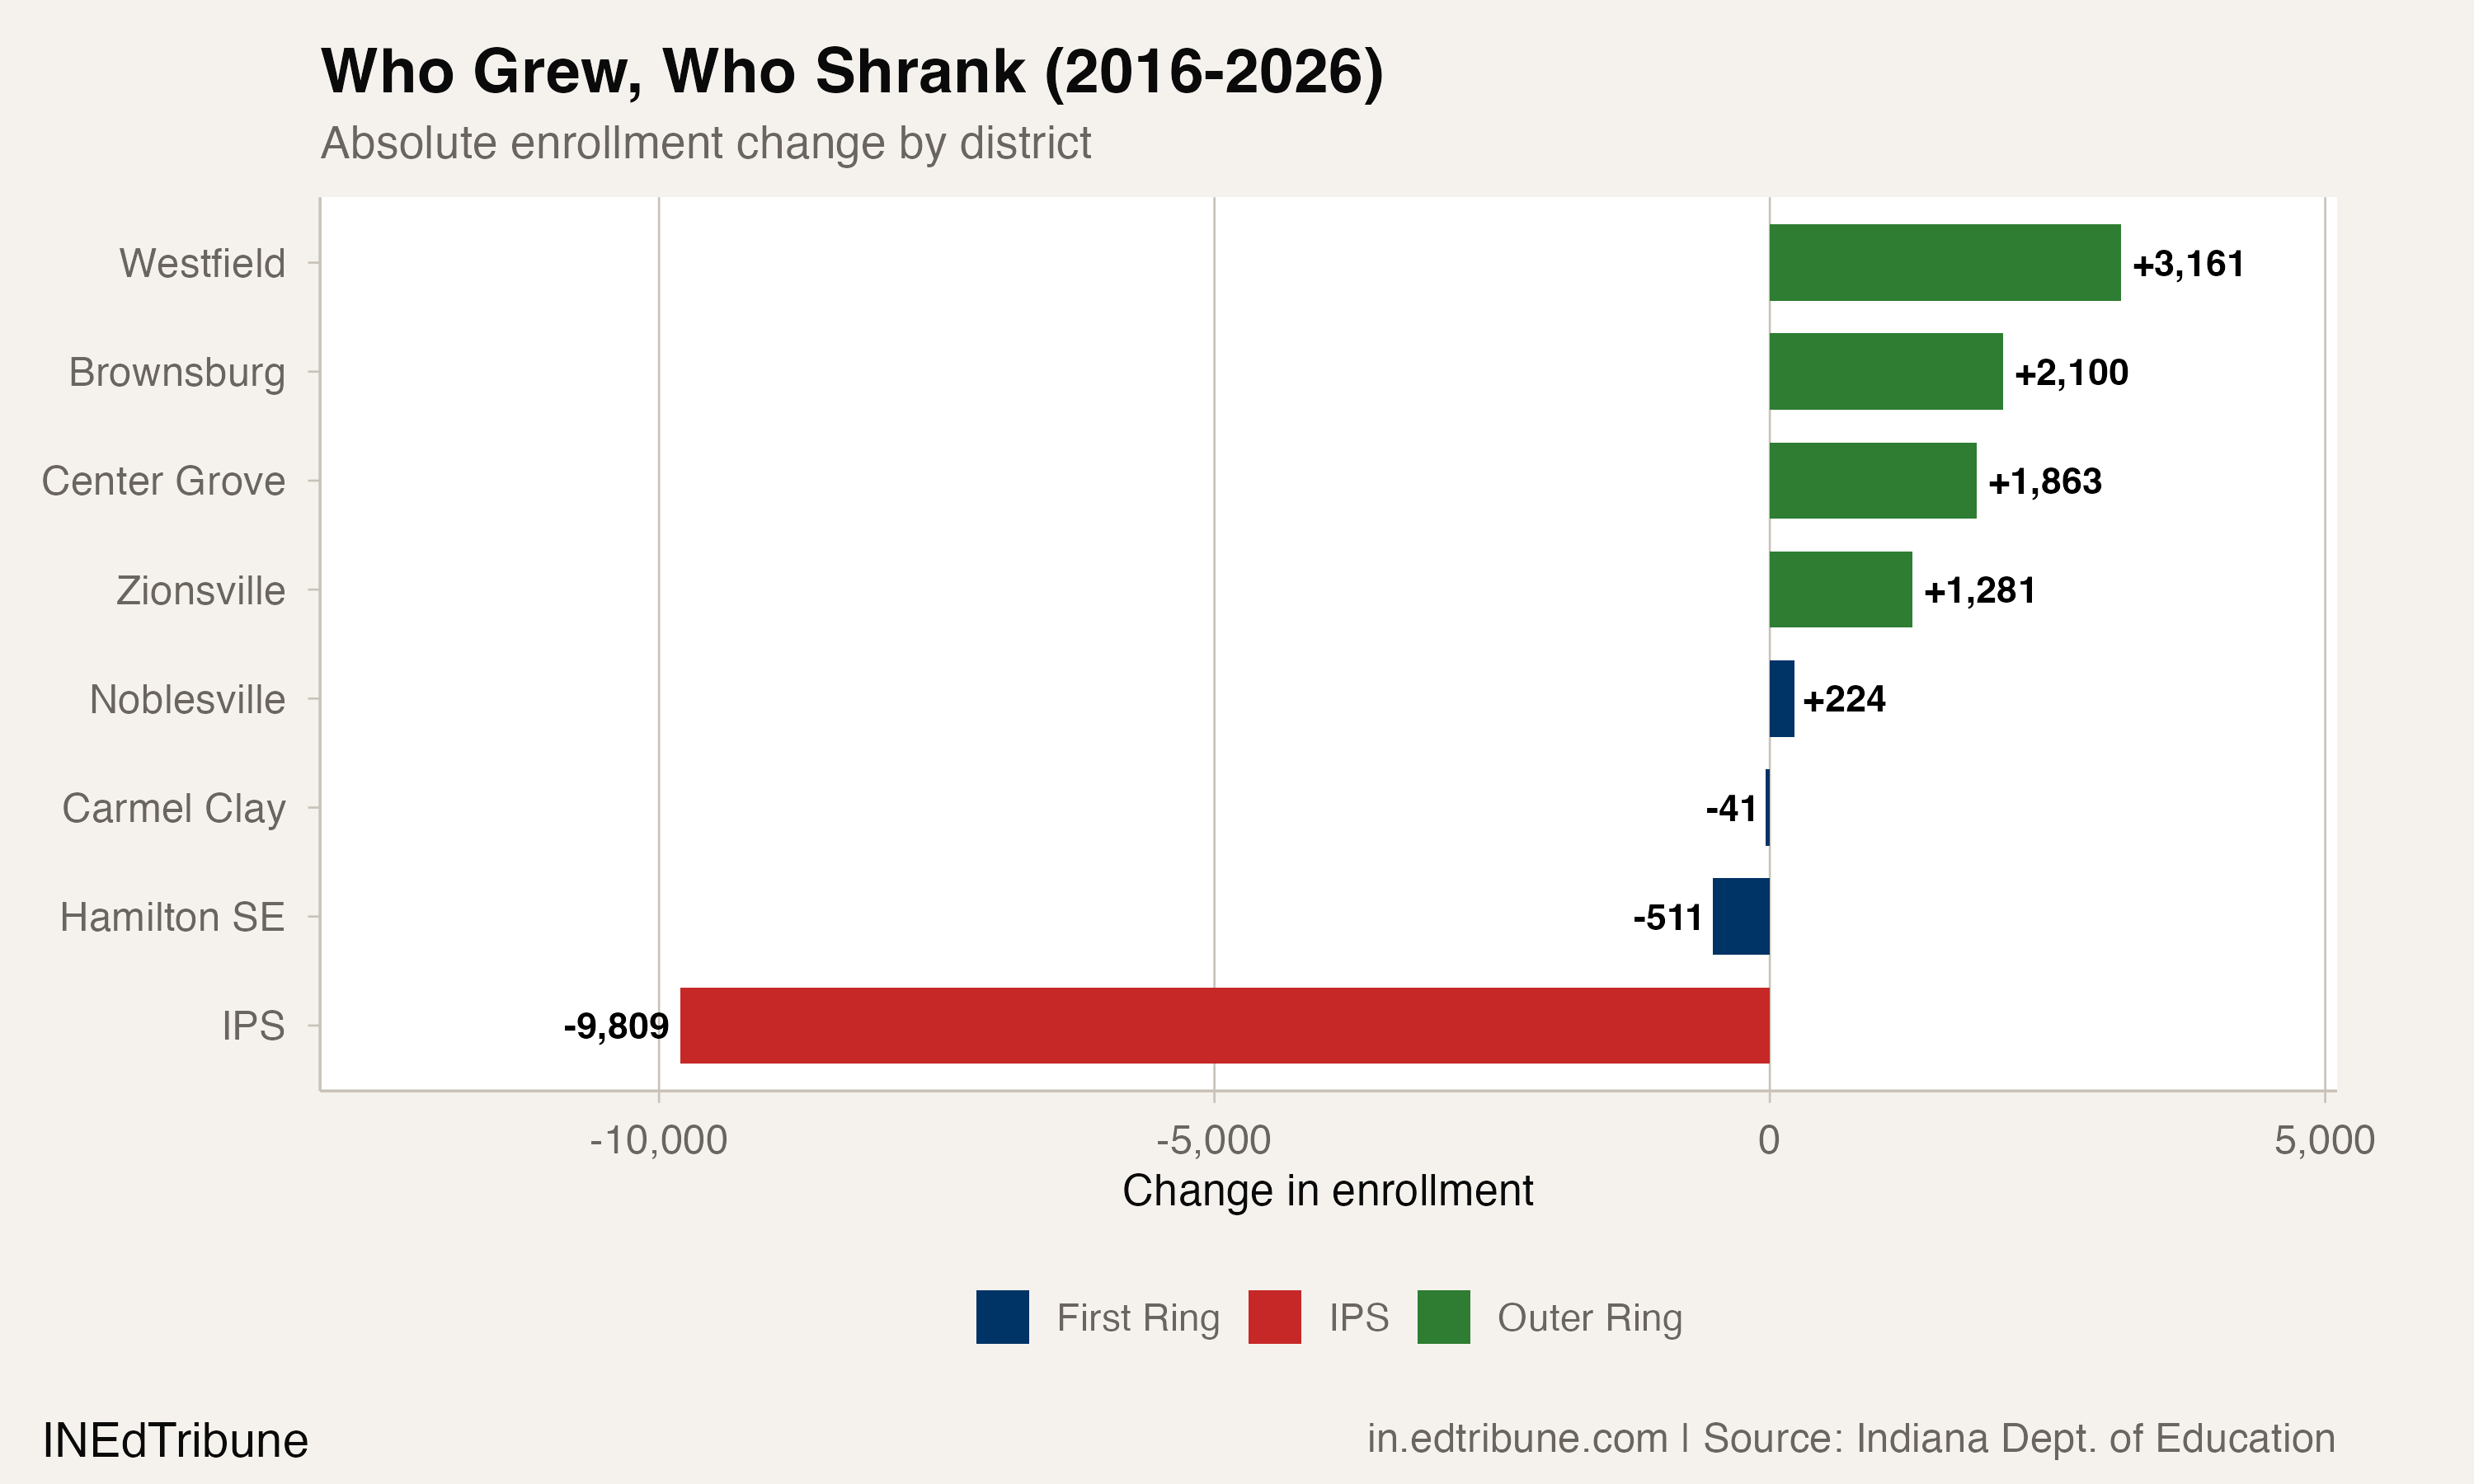
Indianapolis Public Schools↗ET enrolled 19,774 students in 2025-26, down 9,809 from 29,583 in 2015-16. That is a 33.2% decline over 10 consecutive years of losses. At the same time, four outer-ring suburbs, Westfield-Washington↗ET, Brownsburg↗ET, Center Grove↗ET, and Zionsville↗ET, grew every single year over the same period, adding 8,405 students combined and hitting record highs in 2025-26. The 18-district metro area gained just 2,996 students total, a 1.4% increase. The redistribution underneath that flat line is the story.
The donut has layers
The usual suburban donut narrative, where families leave the city for surrounding districts, captures only the first ring of a more complex pattern.
The outer-ring suburbs are the headline. Westfield-Washington added 3,161 students (+43.7%), Brownsburg added 2,100 (+24.6%), Center Grove added 1,863 (+23.4%), and Zionsville added 1,281 (+19.1%). All four grew in all 10 years from 2016 to 2026. All four set enrollment records in 2025-26.
But the first-ring suburbs, the established Hamilton County communities of Carmel Clay↗ET, Hamilton Southeastern↗ET, and Noblesville↗ET, peaked in 2019-20 and have been declining since. Together they lost 2,629 students since that peak, a 5.3% drop. Hamilton Southeastern, the largest of the three, fell from 22,183 to 20,633, a 7.0% decline. Carmel Clay is back below its 2016 level.
The donut is not just expanding outward. It is hollowing from the inside while the next ring out starts to soften. The growth frontier keeps moving.
Inside Marion County, IPS keeps shrinking
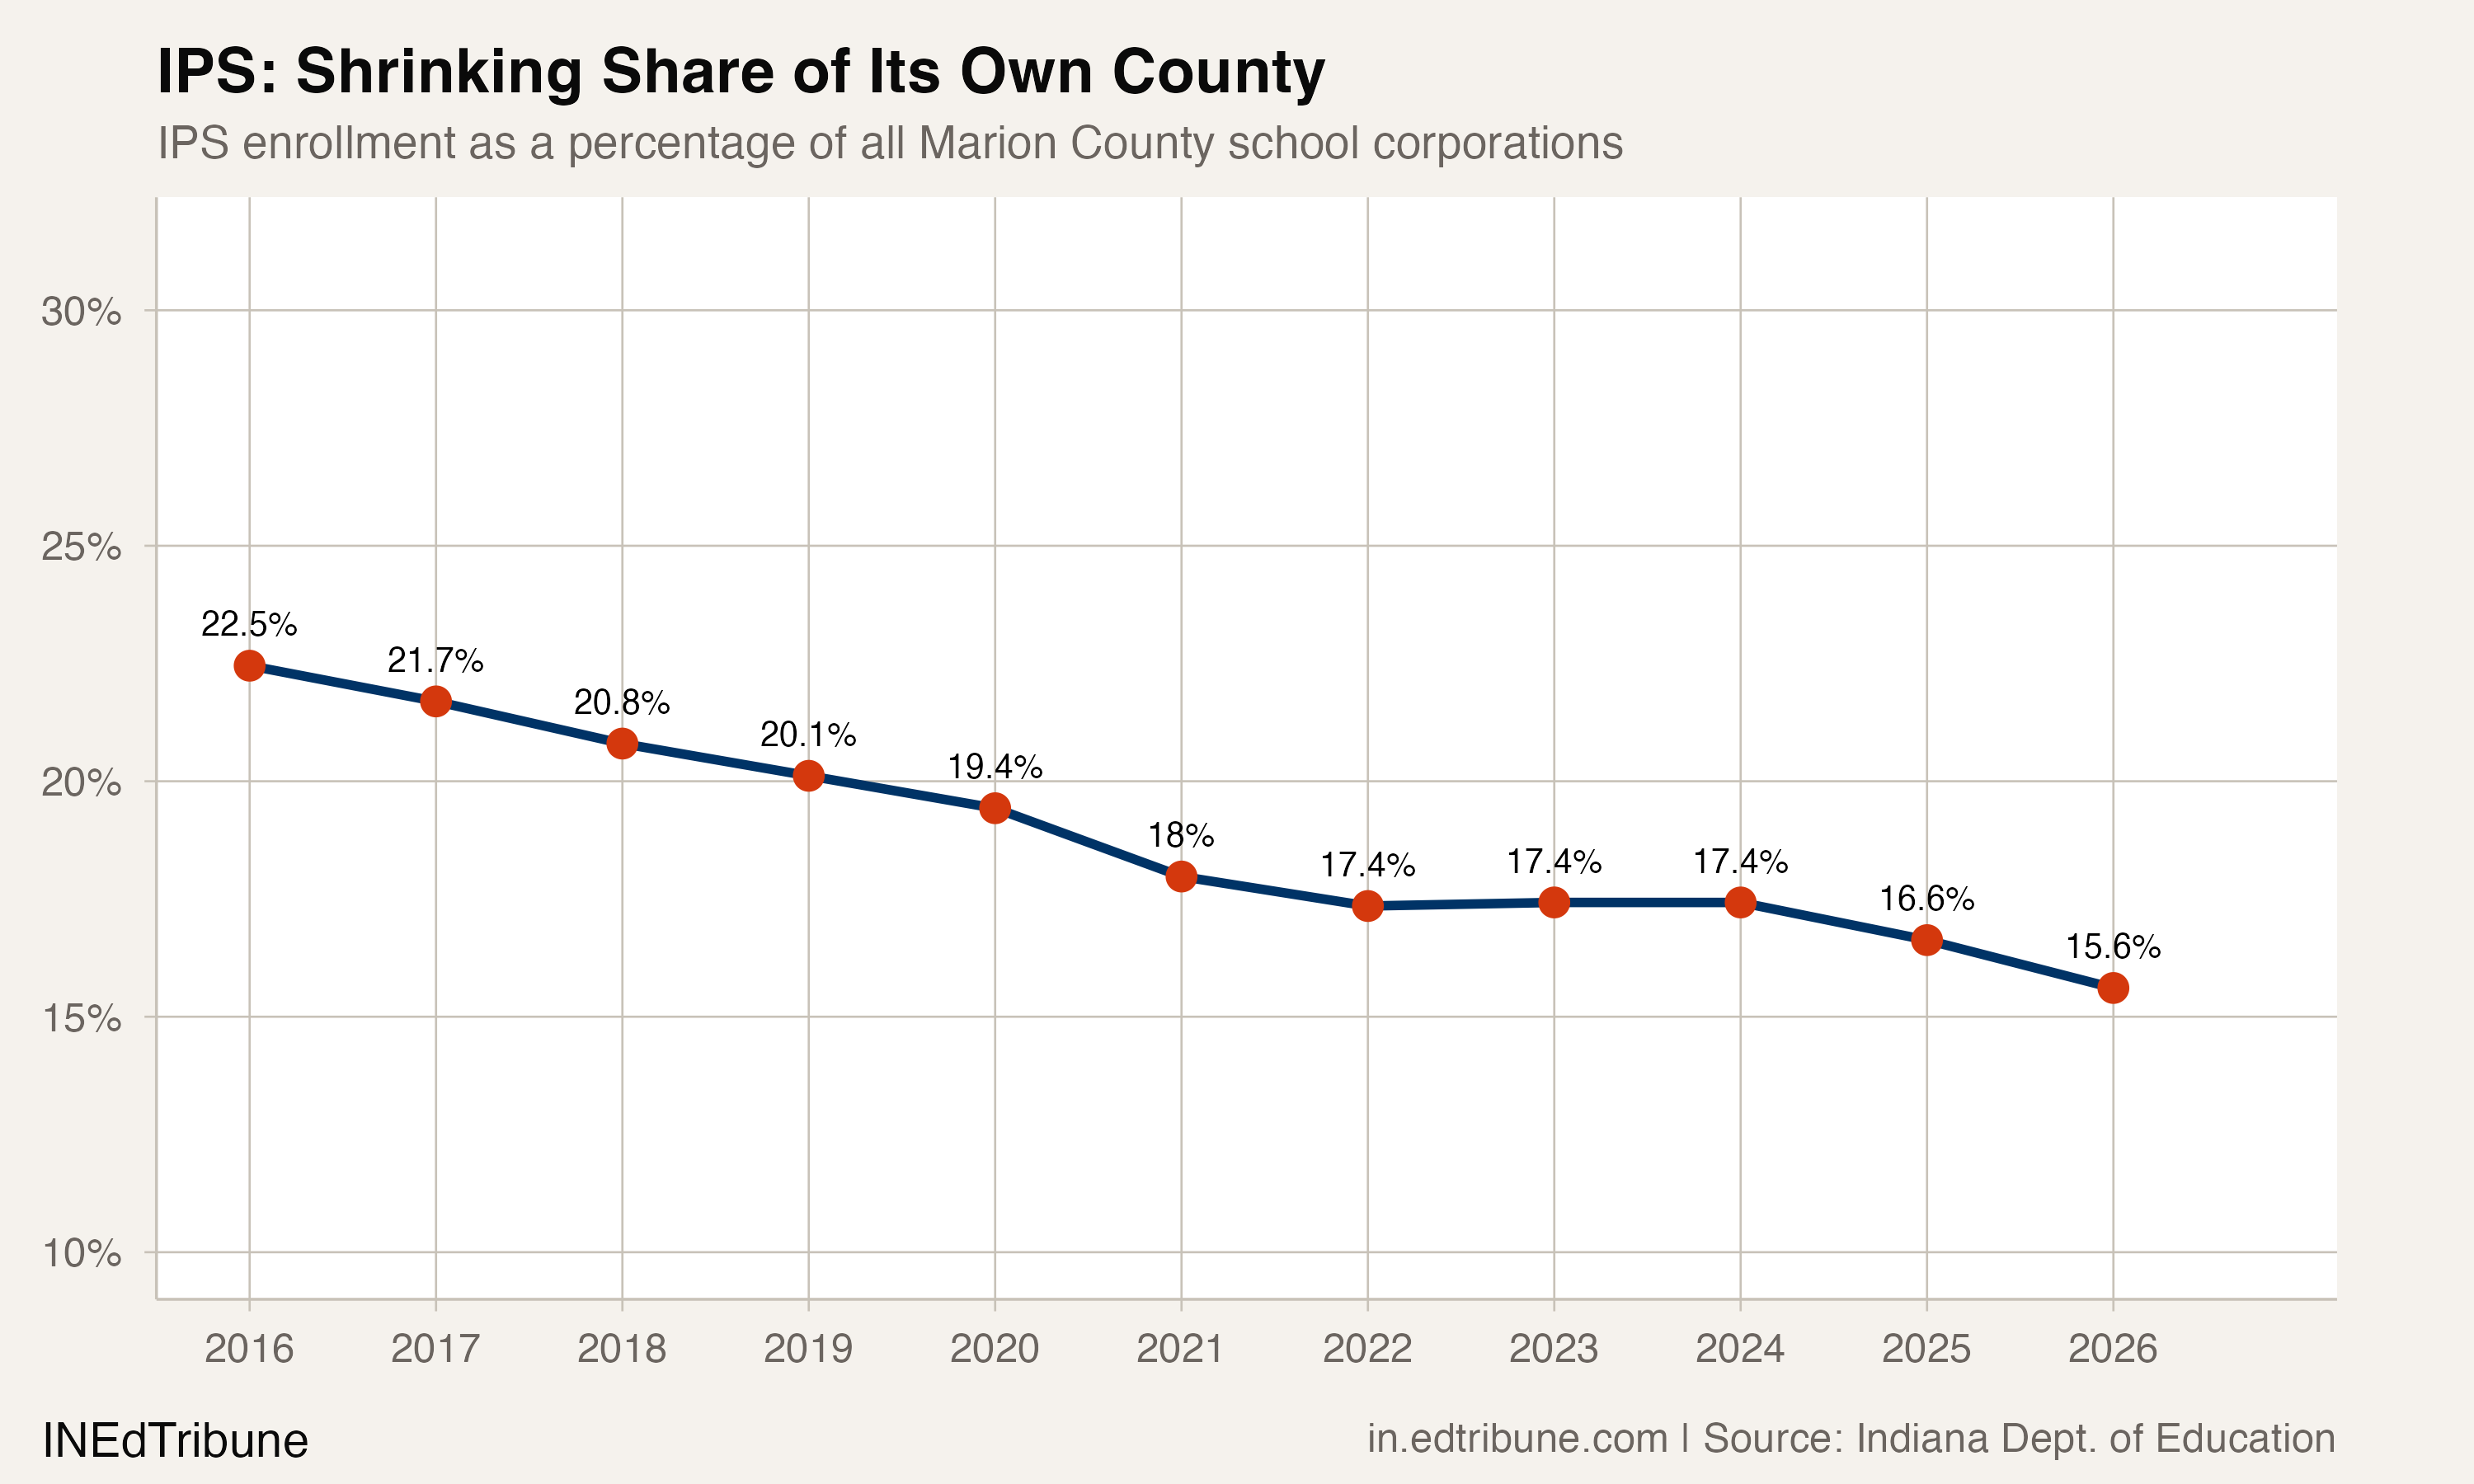
IPS accounted for 22.5% of all Marion County school corporation enrollment in 2015-16. By 2025-26 that share had fallen to 15.6%. The district's kindergarten class tells the pipeline story: 2,797 kindergartners in 2015-16, 1,687 in 2025-26, a 39.7% collapse.
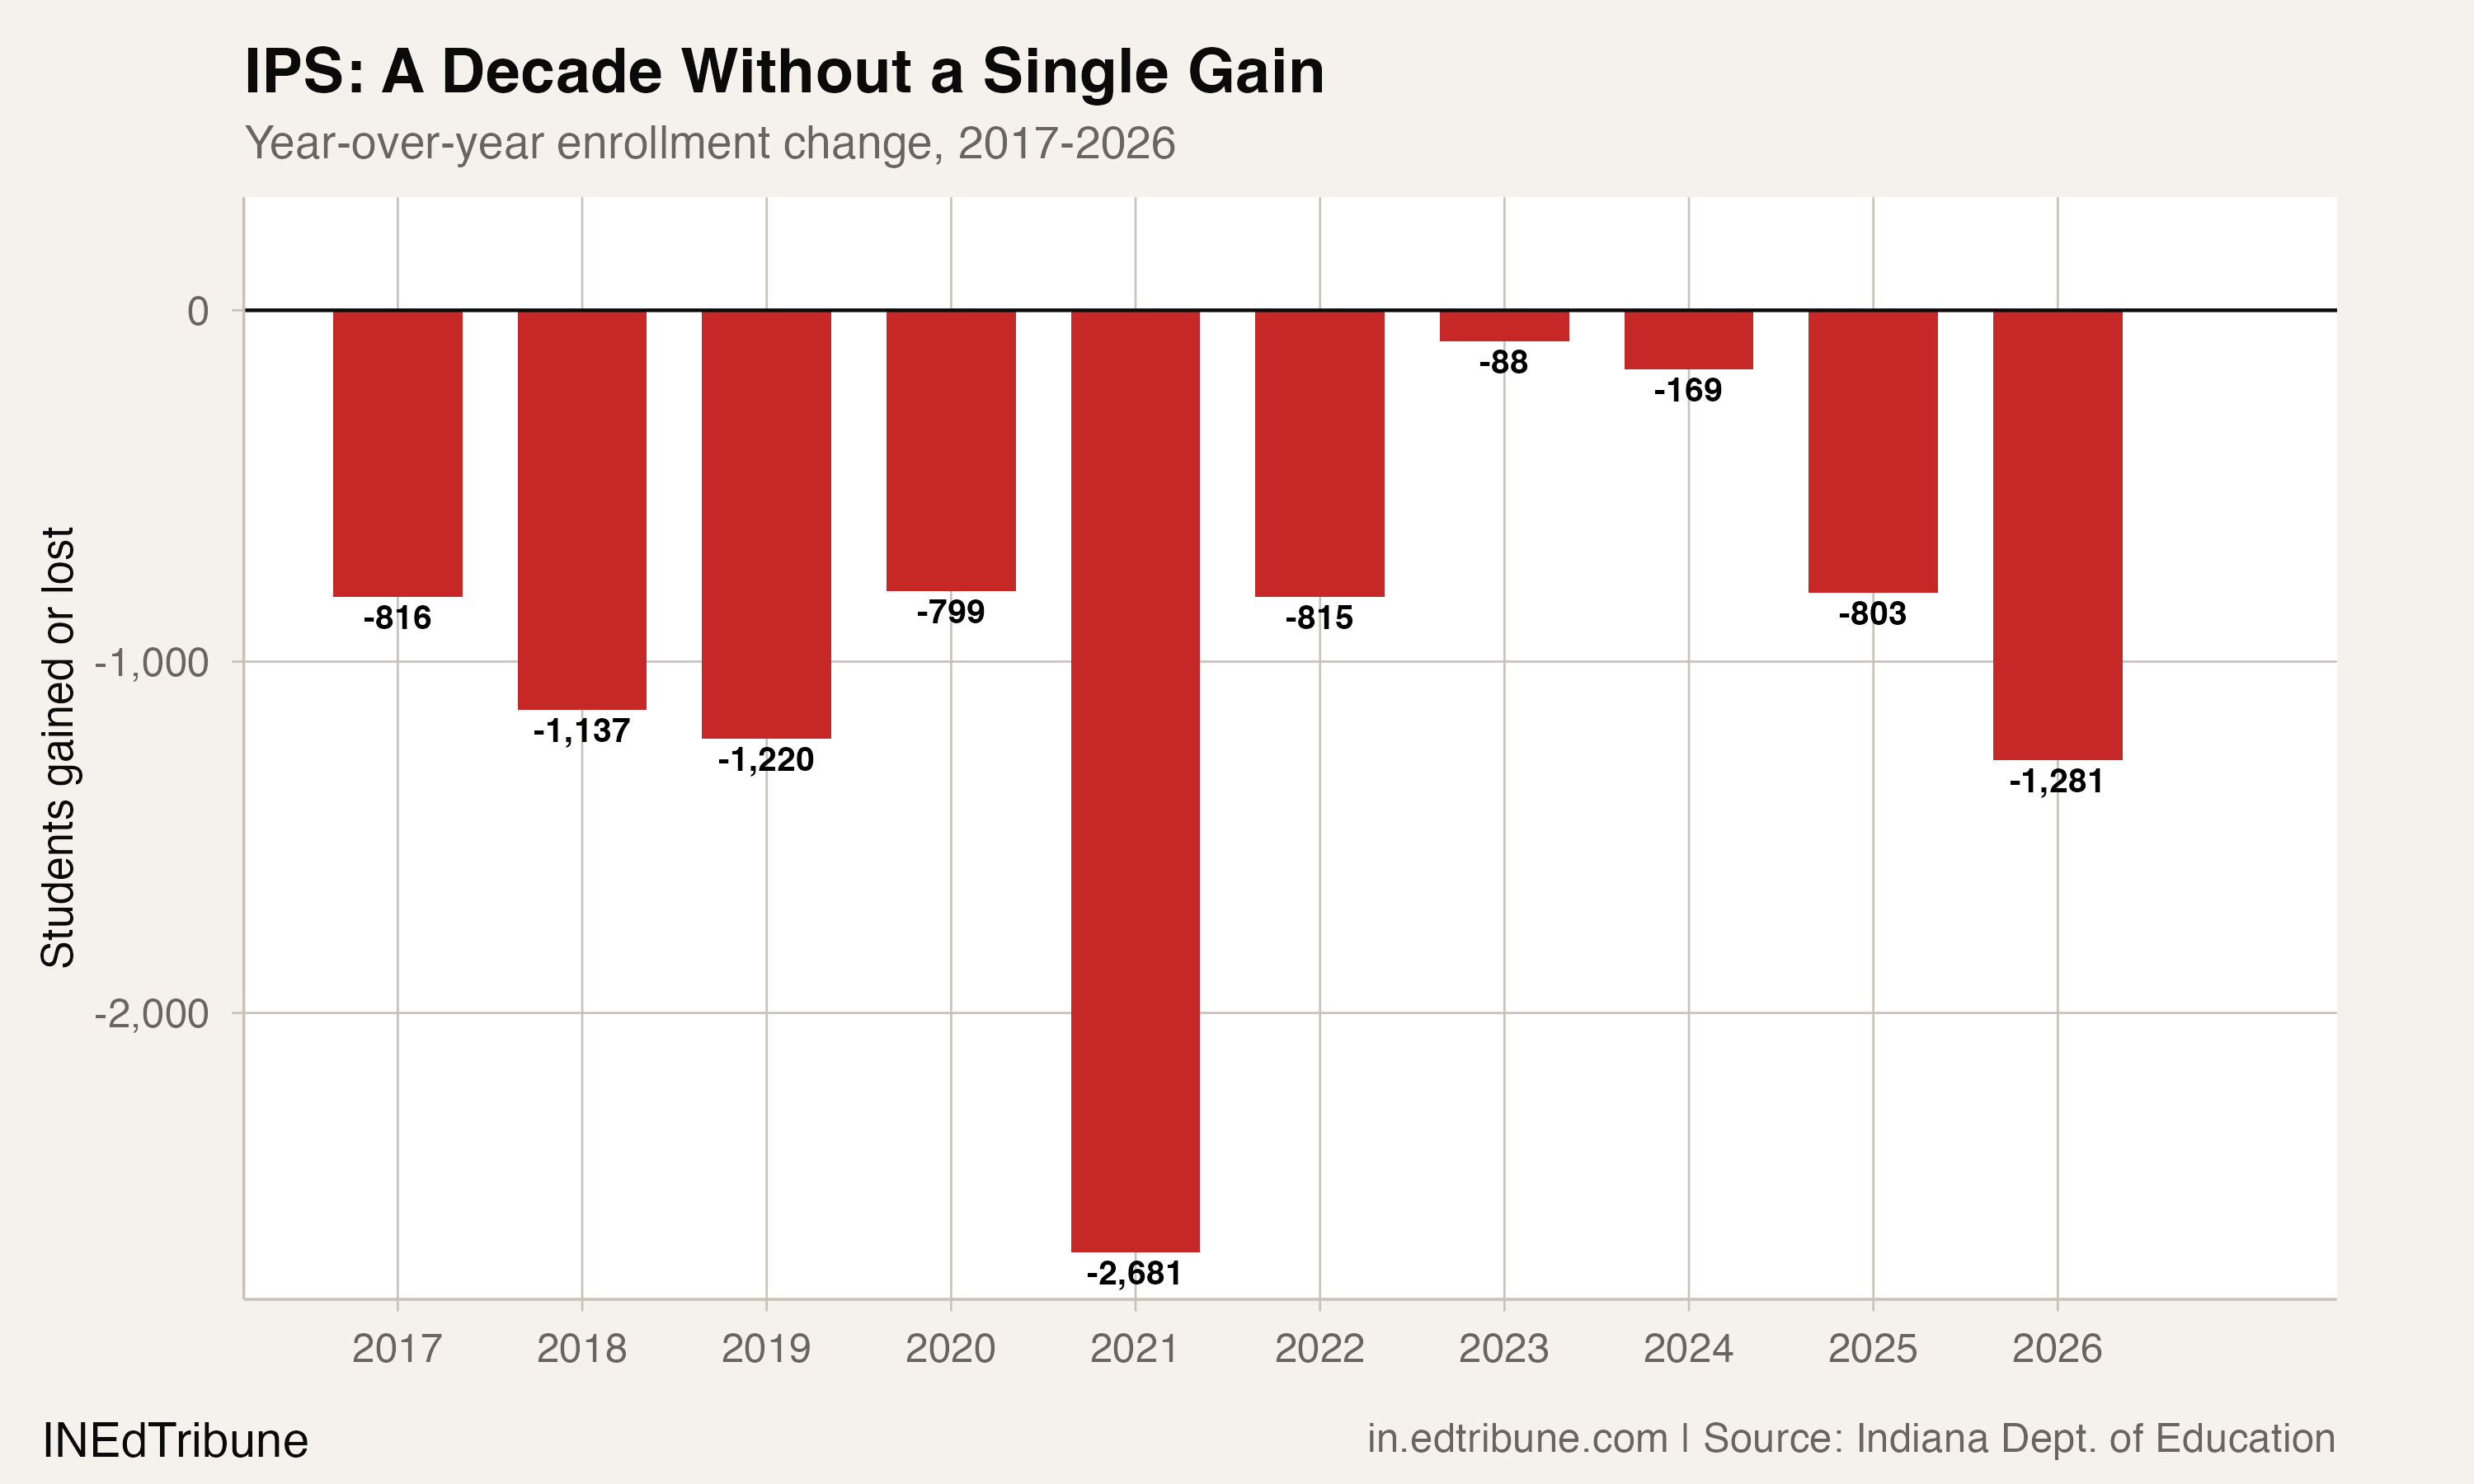
The losses accelerated in 2025-26. IPS shed 1,281 students, the largest single-year drop since the pandemic erased 2,681 students between 2019-20 and 2020-21. The 2025-26 loss is larger than any pre-pandemic year and reversed two years of relative stability when losses had slowed to fewer than 200 students each.
Marion County's other township school corporations, by contrast, collectively gained 4,728 students (+4.6%) over the same decade. Franklin Township↗ET, on the southeast edge, grew by 2,503 students (+27.6%), matching the outer suburbs' growth rate from within the county line.
Where the students are going
IPS operates in a school choice environment unlike any other in the state. Within and near IPS boundaries, 61% of public school students now attend charter or innovation network schools rather than IPS-managed schools, up from 51% in 2019-20, according to The Mind Trust.
The charter sector is not a simple beneficiary of IPS losses, however. Independent charter and innovation network schools in Indianapolis enrolled roughly 22,000 students in 2025-26, down nearly 3% from the prior year. Both sectors are losing students, which points to demographic contraction rather than a zero-sum transfer.
Outward migration is a second mechanism. Census estimates through 2022 showed Marion County losing population while Westfield ranked sixth nationally in growth among cities of 50,000 or more, adding 3,903 residents in a single year. Young families follow new housing stock, and the outer suburbs have been building aggressively: Westfield alone considered a 2,200-home development in late 2025.
A third factor is the maturation cycle hitting the first ring. Carmel, Fishers, and Noblesville were the growth suburbs of the 2000s. Their housing stock has aged, their lots are filled, and the families who moved in during the building boom are aging out of school-age children. The enrollment plateau, then decline, follows the same arc that IPS experienced a generation earlier.
The fiscal math
Indiana's tuition support formula distributes state funding on a per-pupil basis. At roughly $8,800 per student, the loss of 9,809 students since 2015-16 represents approximately $86 million in annual state funding that no longer flows to IPS. That is not a one-time cut. It compounds: fewer students mean fewer dollars, which can mean reduced programming, which can push more families toward alternatives.
Chalkbeat reported in August 2025 that Indianapolis had roughly 9,000 more seats than students across IPS and charter schools, with nearly 7,000 empty on the IPS side. One-third of IPS buildings operated below 60% capacity.
Chalkbeat reported in August 2025 that Indianapolis had roughly 9,000 more seats than students across IPS and charter schools, with nearly 7,000 empty on the IPS side. The 2025-26 loss of 6.1% outpaced even the most pessimistic projections.
Diversifying at every ring
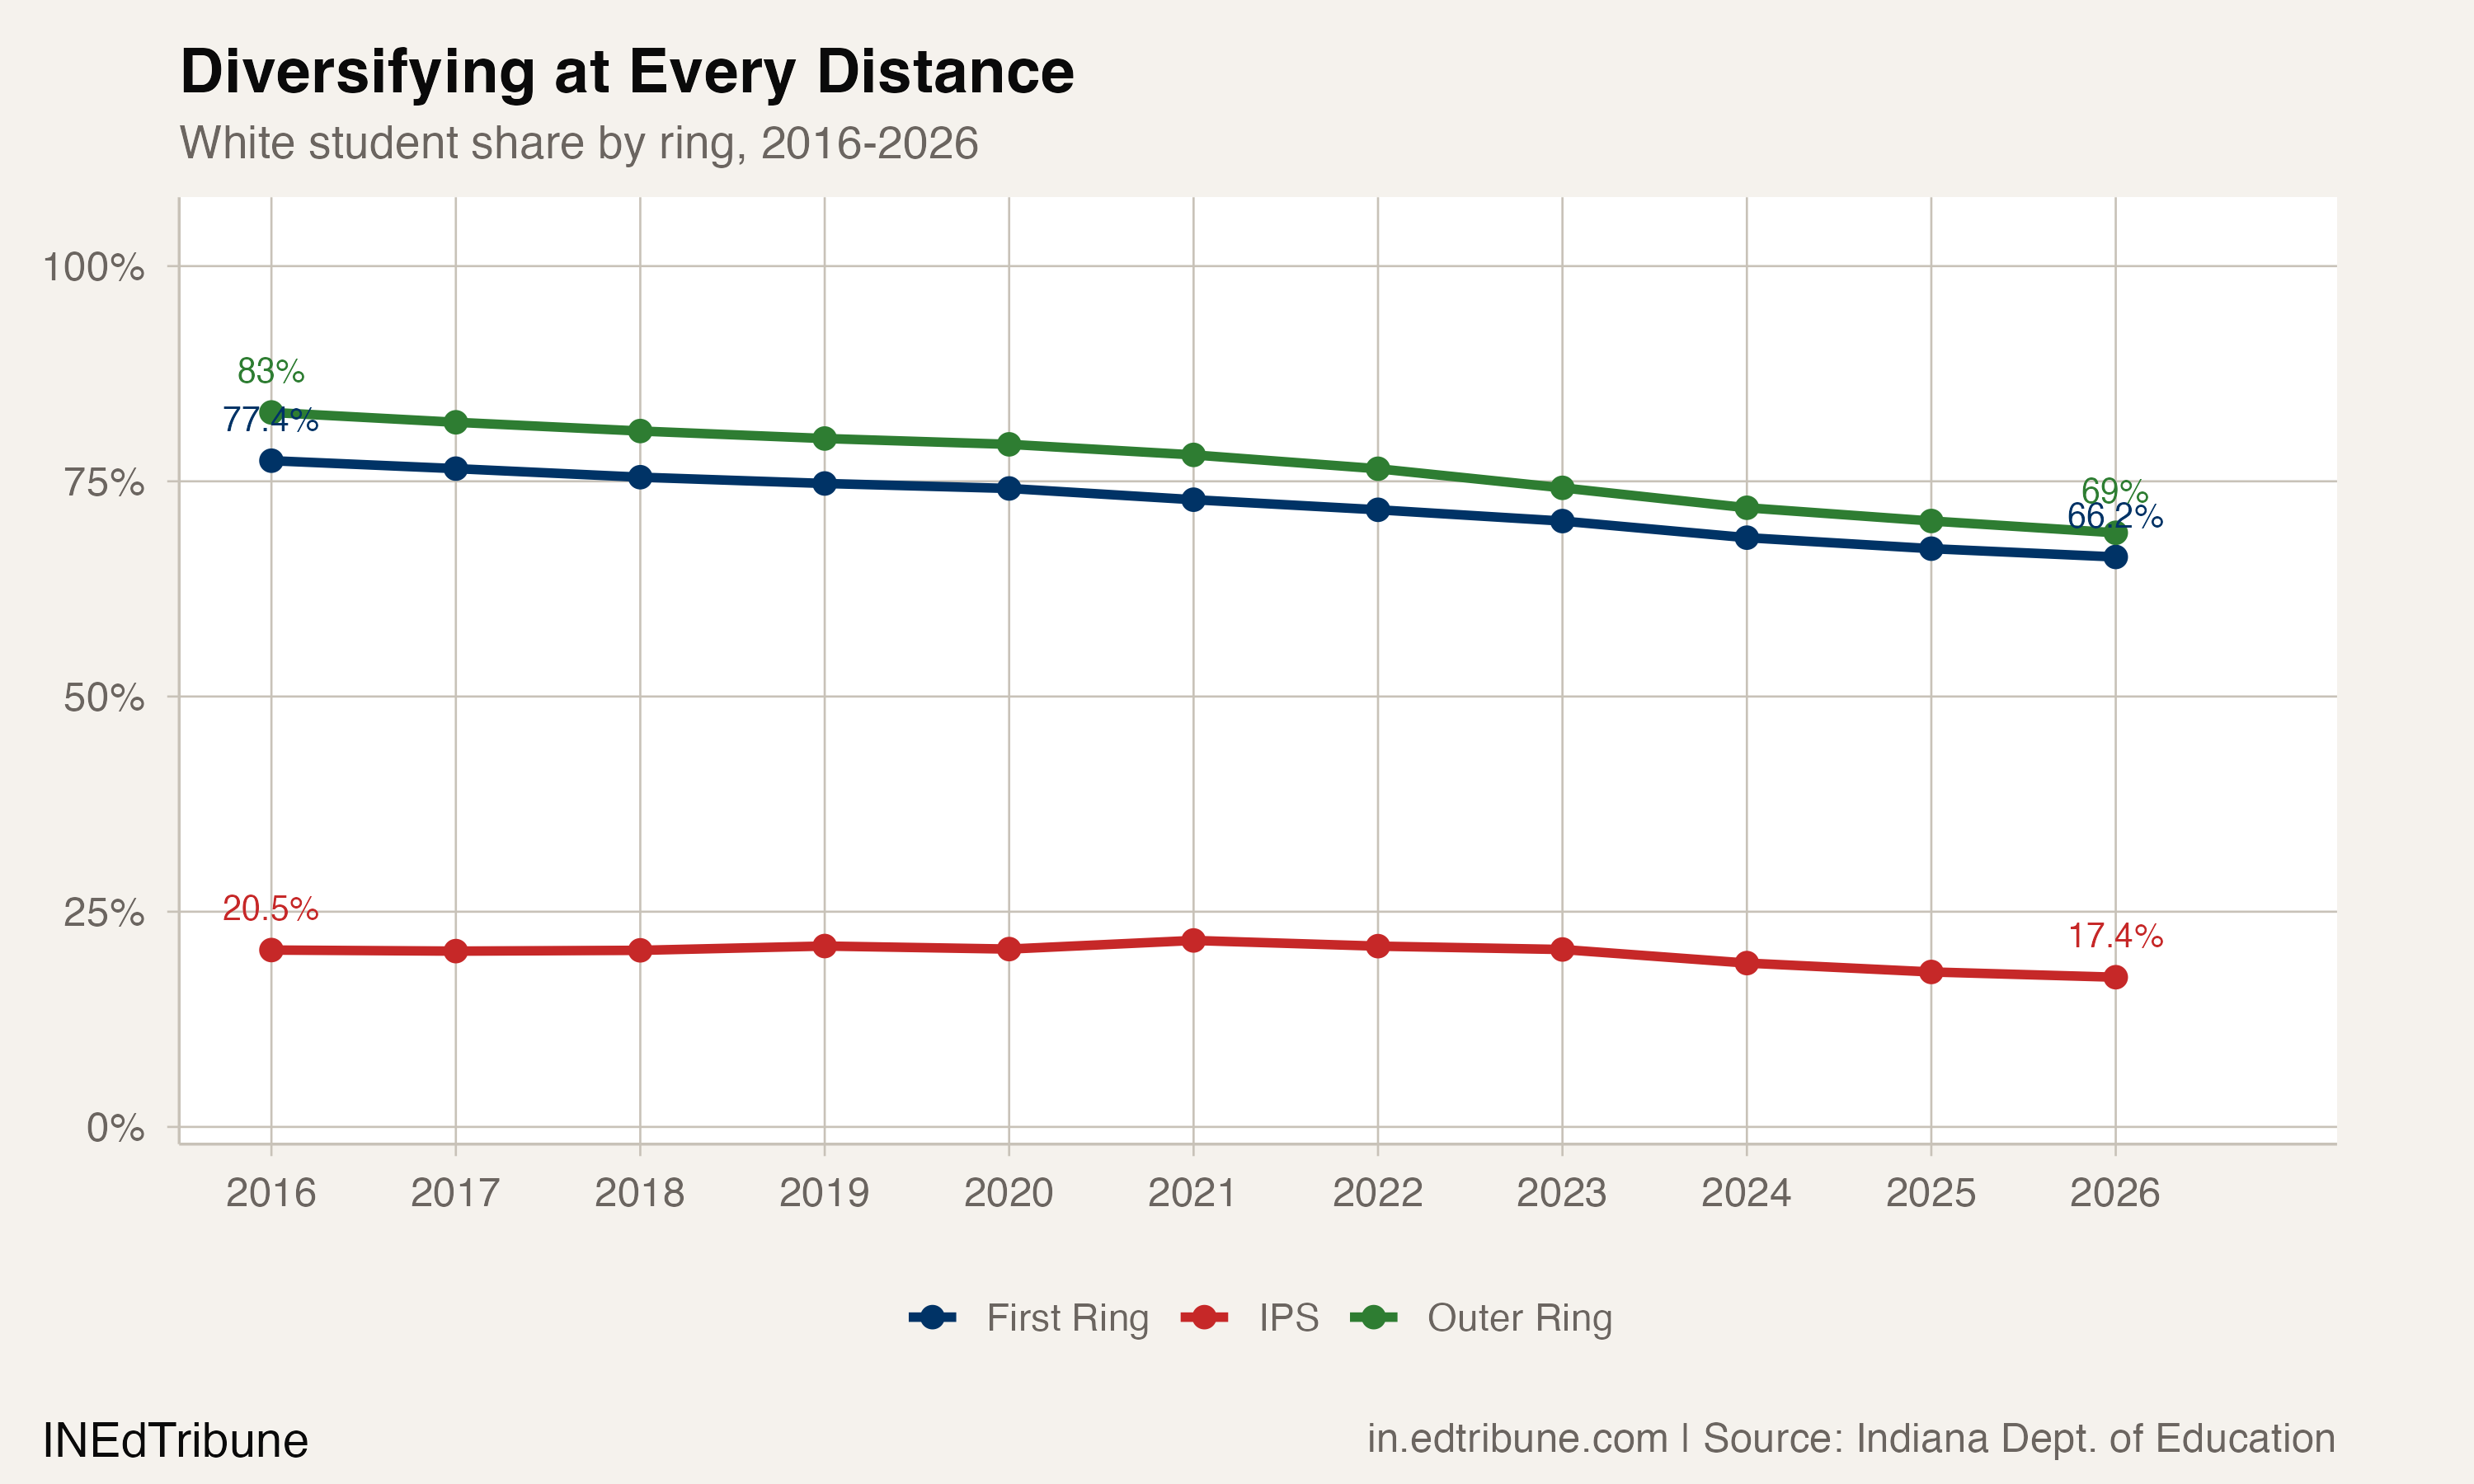
The demographic shifts complicate a narrative that frames suburban growth as white flight. All three rings are diversifying, and the suburbs are diversifying faster than IPS.
IPS was 20.5% white in 2015-16 and 17.4% in 2025-26, a 3.1 percentage-point shift. The first-ring suburbs dropped from 77.4% to 66.2% white over the same period, an 11.2-point swing driven partly by rapid Asian student enrollment growth (from 7.6% to 11.5% of the first-ring population). The outer ring fell from 83.0% to 69.0% white, a 14-point decline as Black, Hispanic, and Asian enrollment grew across Westfield, Brownsburg, Center Grove, and Zionsville.
The students moving outward are not exclusively white. The outer ring's Black student population nearly tripled from 1,344 to 3,795 over the decade. Hispanic enrollment more than doubled from 1,522 to 3,330. What looks like a classic suburban donut from a distance is, at closer range, a broader demographic redistribution that is reshaping the suburbs as much as it is emptying the urban core.
The ring that ran out of room
The metro area's near-zero-sum arithmetic means that every student gained in an outer suburb roughly corresponds to a student lost somewhere else. Carmel, Fishers, and Noblesville were the growth suburbs of the 2000s. Their lots are filled, their housing stock has aged, and the families who moved in during the building boom are watching their youngest children graduate. Hamilton Southeastern has lost 1,550 students since its 2020 peak. Carmel Clay is back below its 2016 level.
Westfield and Brownsburg are still growing, still building. But Westfield's housing permits dropped 34% through November 2025, and city leaders estimate they need 2,200 home sales per year to sustain enrollment growth. They have averaged closer to 1,600. When the outer ring's growth slows, the donut stops expanding. What remains is IPS, operating buildings at one-third capacity in a county where it educates barely one in six public school students, with 1,687 kindergartners where a decade ago there were 2,797.
Detailed code that reproduces the analysis and figures in this article is available exclusively to EdTribune subscribers.
Discussion
Sign in to join the discussion.
Loading comments...