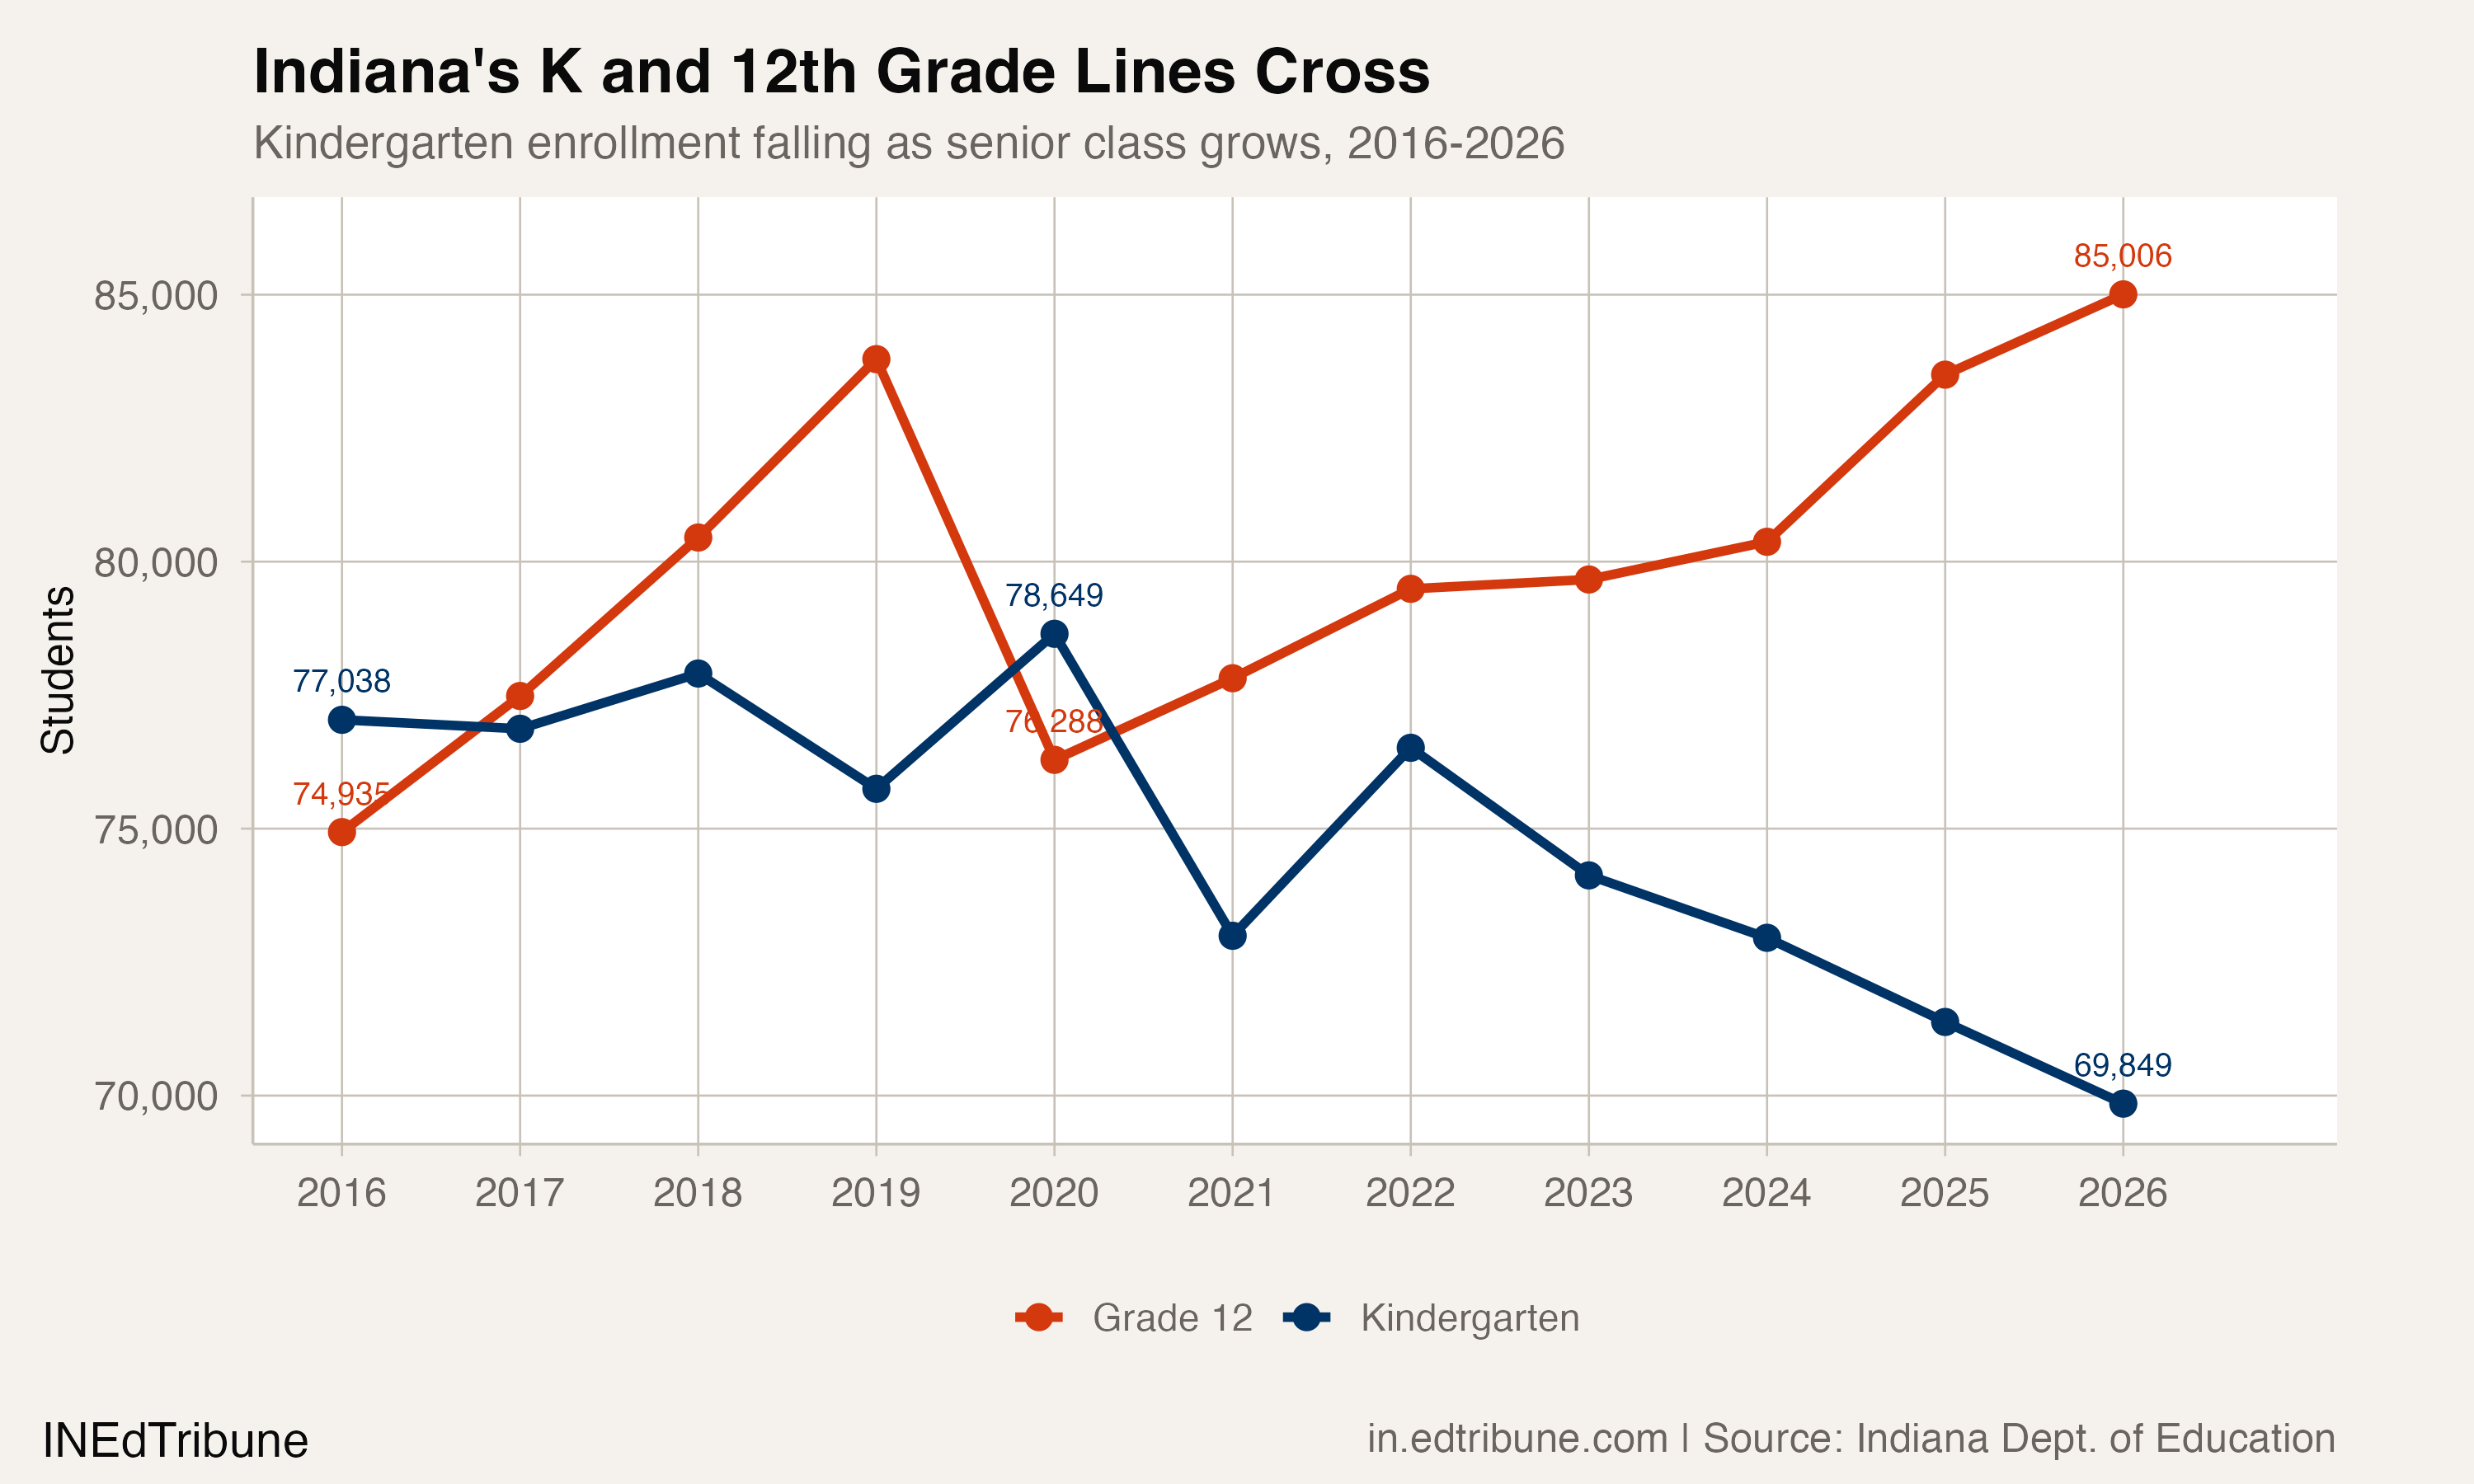
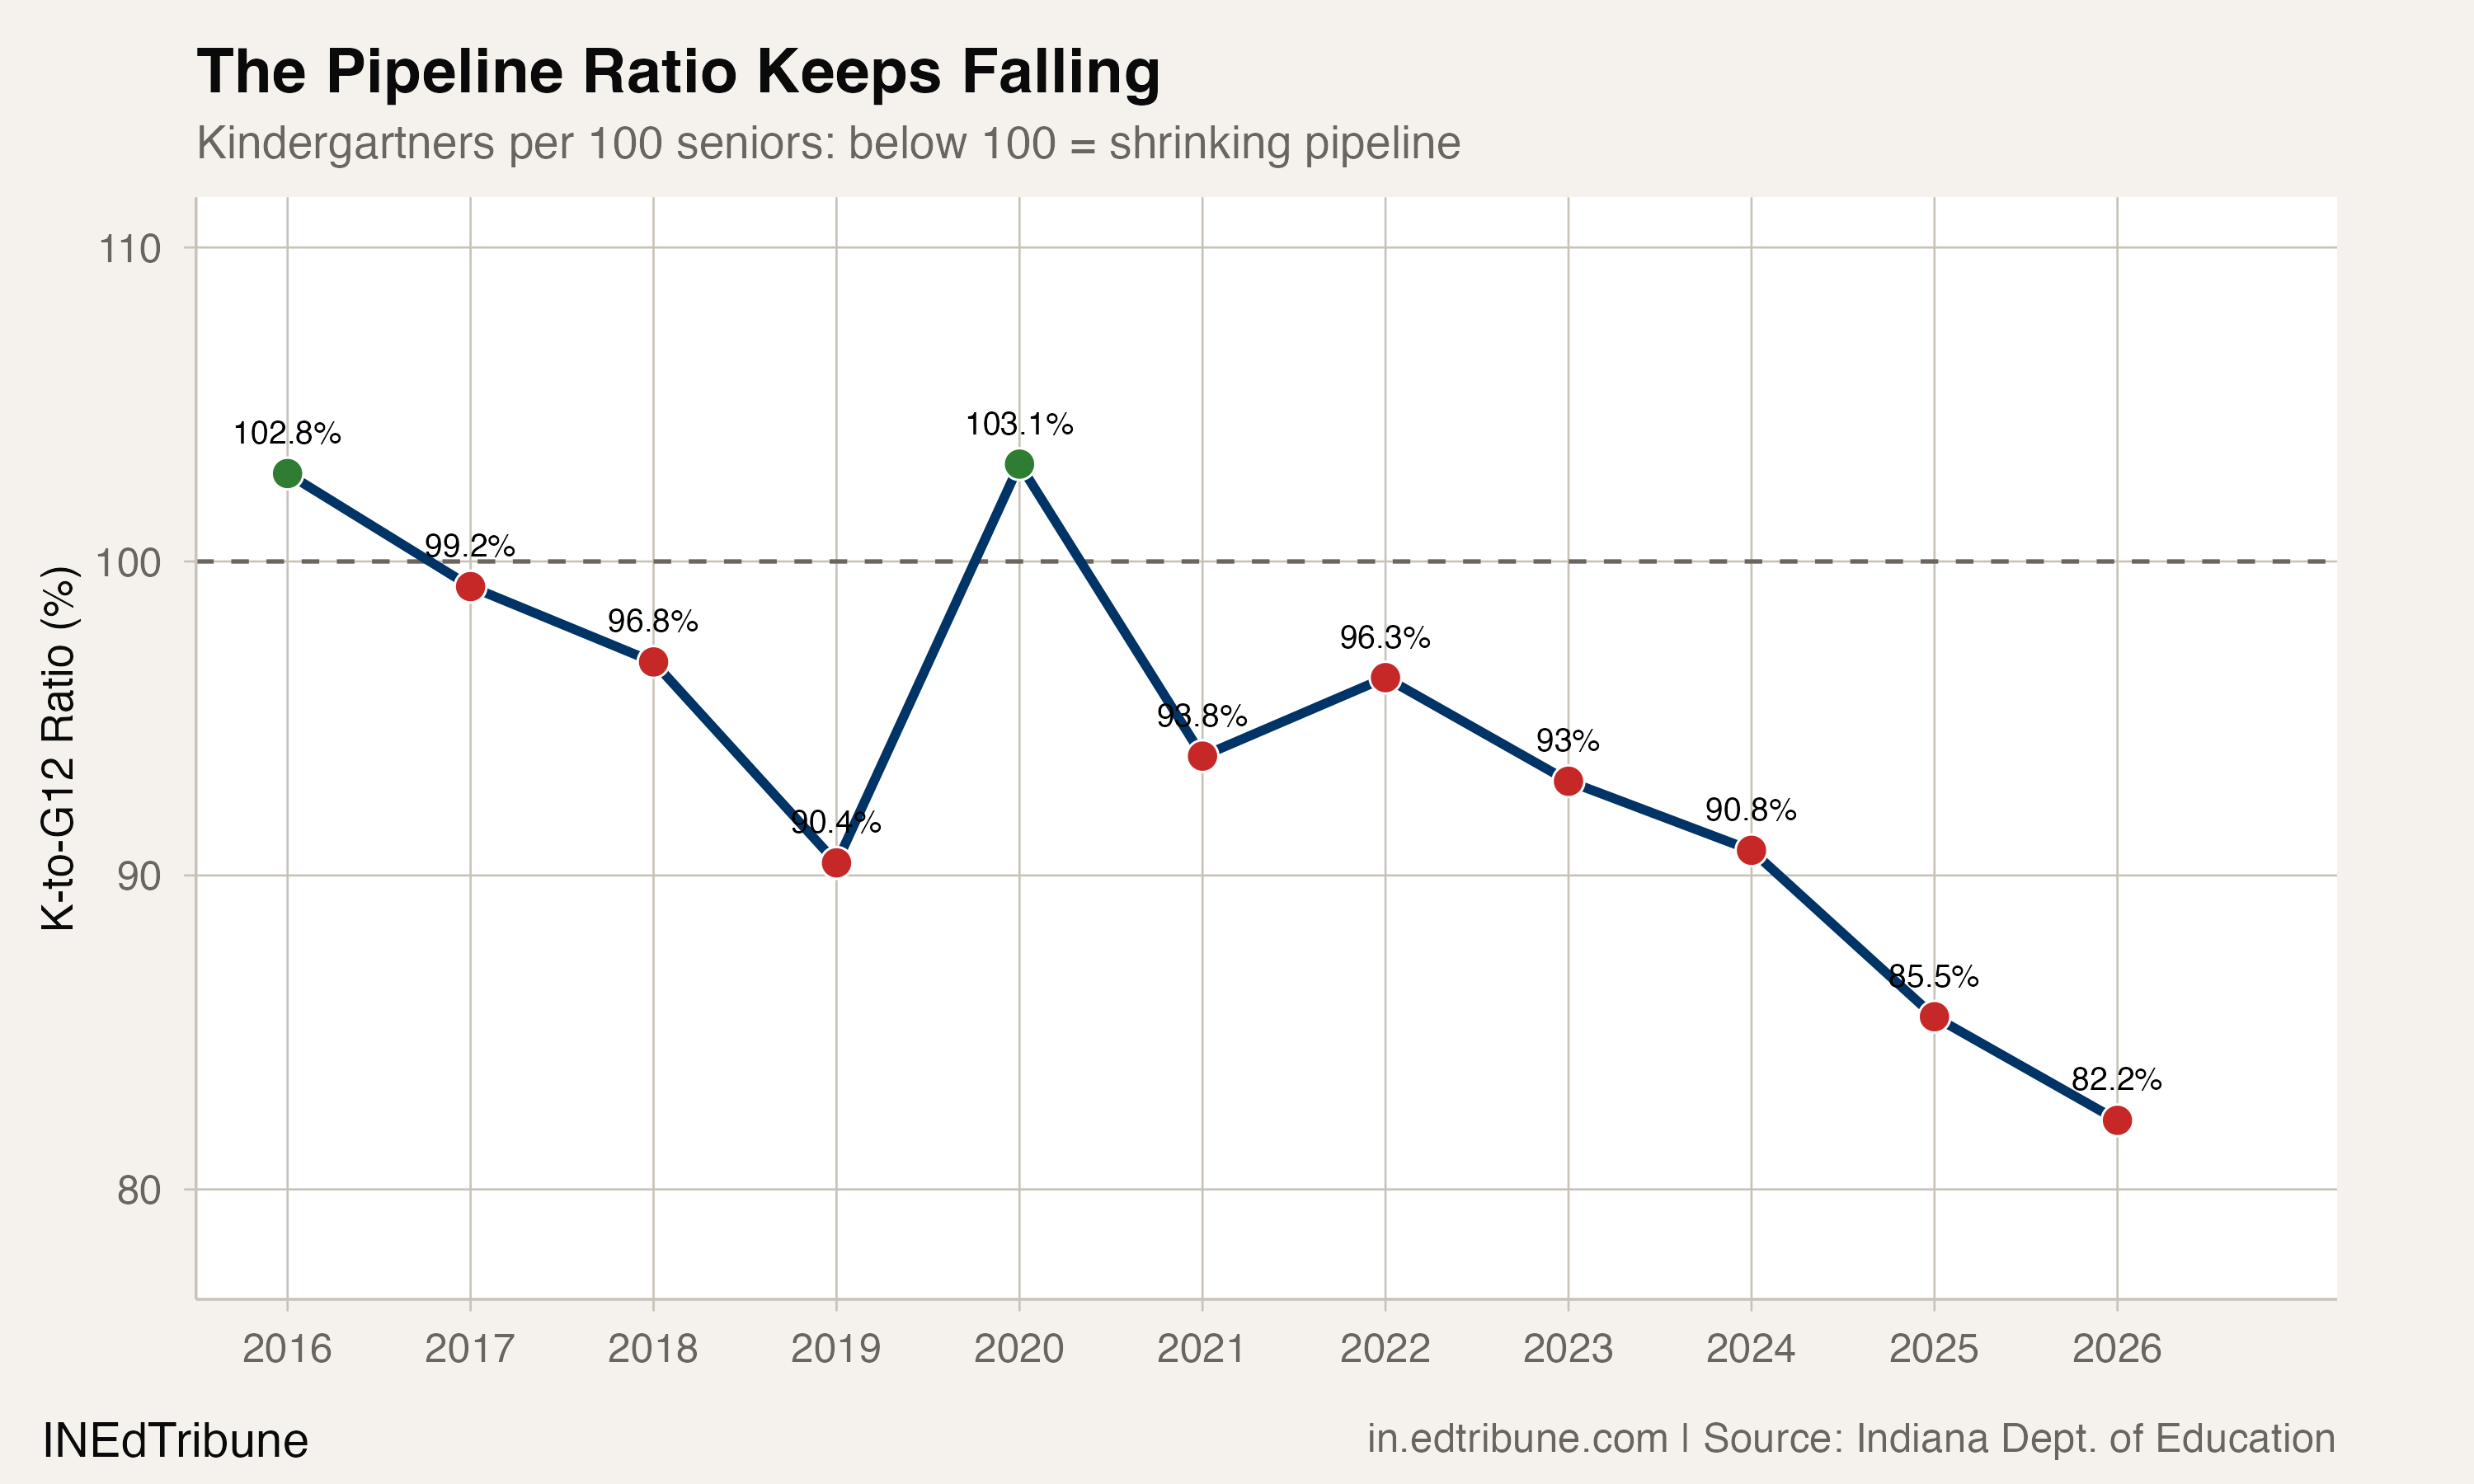
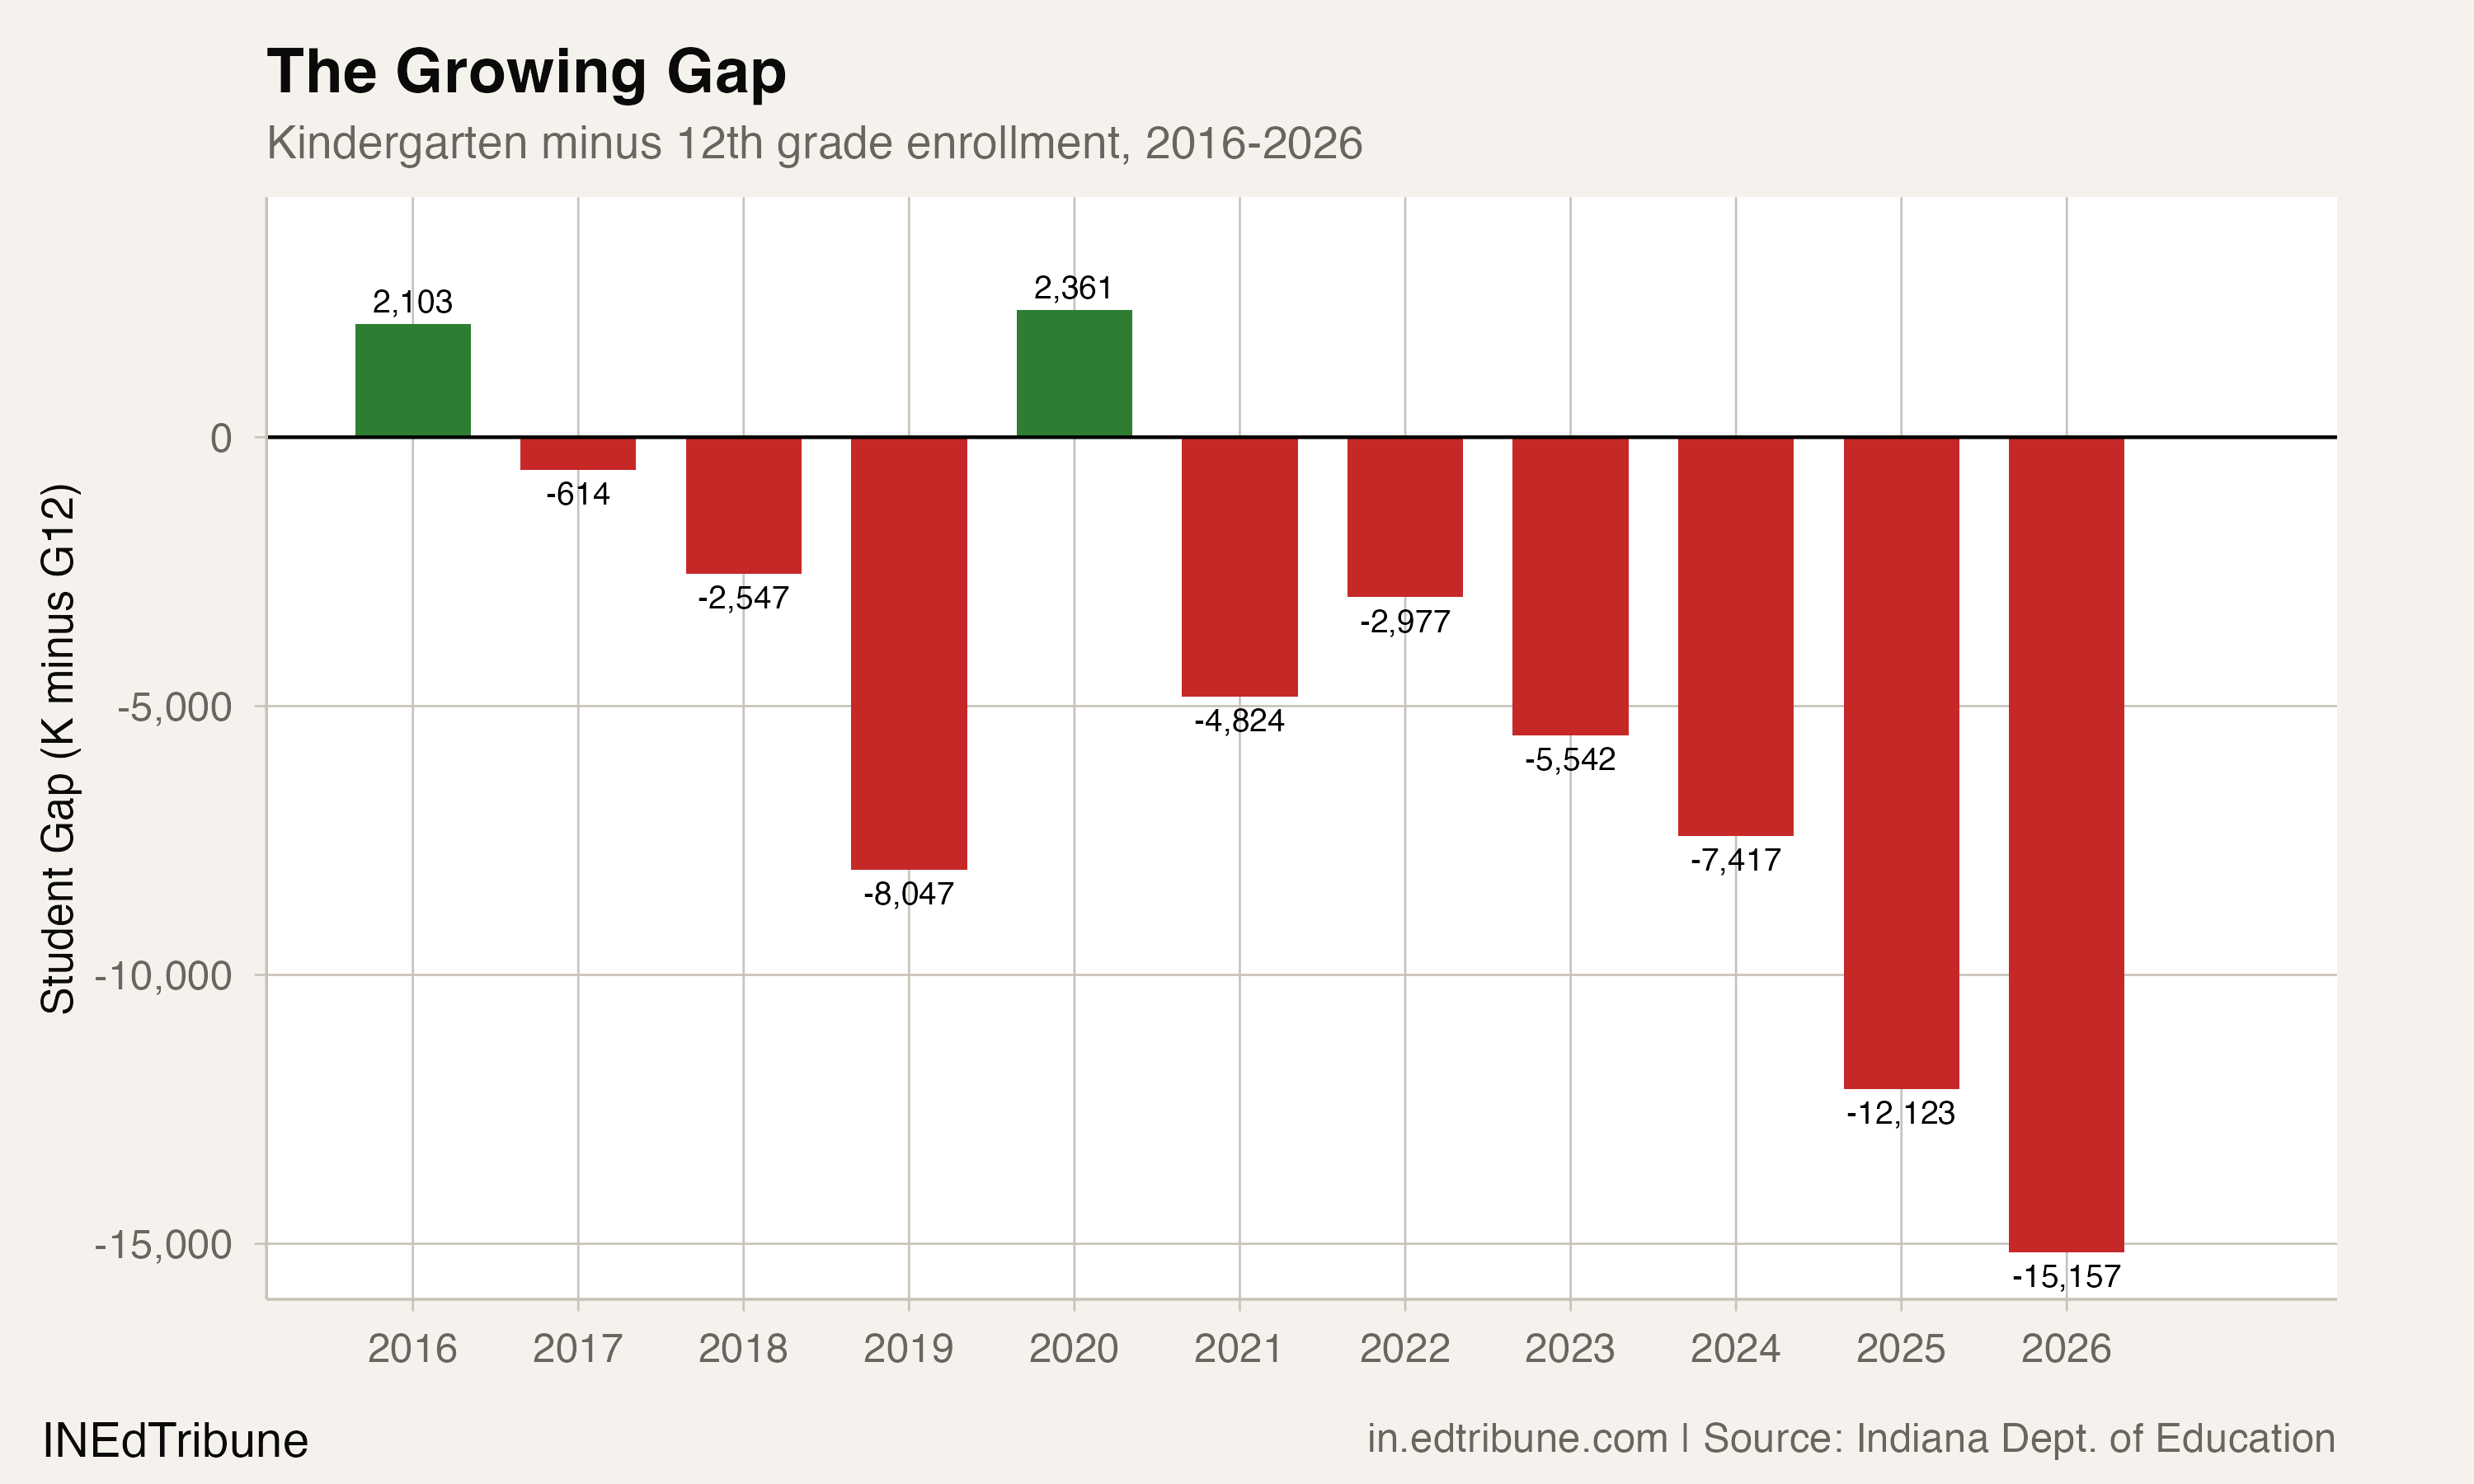
In 2016, Indiana enrolled 2,103 more kindergartners than 12th graders. In 2026, that relationship has flipped: the state's senior class of 85,006 outnumbers its kindergarten class of 69,849 by 15,157 students. The ratio of kindergartners to seniors has fallen from 102.8% to 82.2%, a structural shift that no amount of policy intervention can reverse within the next decade.
The pipeline inversion is not a single-year anomaly. Indiana's kindergarten class has been smaller than its senior class in nine of the last 11 years, with a gap that has nearly tripled since 2023. Each undersized kindergarten cohort will ripple upward through every grade for 12 years, suppressing enrollment long after the children who weren't born have been forgotten by the news cycle.
Two lines moving in opposite directions
The mechanics are straightforward. Within the past decade, kindergarten enrollment topped out at 78,649 in the 2019-20 school year and has fallen 11.2% since, landing at 69,849 in 2025-26. Over the same window, 12th grade enrollment rose from 74,935 to 85,006, a 13.4% increase. The two lines crossed definitively around 2017 and have been diverging since.
The kindergarten decline is not uniform across the decade. After the peak in 2020, enrollment dropped sharply to 72,993 in the pandemic year of 2020-21, partially recovered to 76,514 in 2021-22, and has fallen in four consecutive years since. The 2025-26 kindergarten class of 69,849 is the smallest in the 11-year window.
Meanwhile, 12th grade enrollment has climbed in seven of the last eight years. The 85,006 seniors enrolled in 2025-26 represent a record for the decade, driven in part by improving graduation persistence. The 11th-to-12th-grade transition rate has exceeded 100% for four straight years, reaching 102.6% in 2025-26, meaning more students are counted in 12th grade than were counted in 11th grade the year before. Record-high graduation rates, which hit 91.8% for the class of 2025, suggest fewer students are dropping out before senior year. Some portion of the 12th grade bulge also likely reflects students taking longer to complete graduation requirements.
The birth cohorts behind the kindergarten cliff
The children enrolling in kindergarten in 2025-26 were born in 2019 and 2020. Indiana recorded roughly 81,000 births in 2019 and approximately 79,000 in 2020, both well below the state's 2007 peak of 89,900 births. The kindergarten class of 2027-28, drawn from children born in 2021, will reflect the full force of the COVID-era baby bust, when Indiana births fell to their third-lowest level since 1946.
A modest rebound in 2024, when Indiana recorded 80,257 births, offers limited relief. That 1.6% increase over 2023 was driven entirely by births to foreign-born mothers, which surged 43% between 2021 and 2024, while births to U.S.-born mothers continued to decline. Even at 80,257, the state's birth count remains more than 10,000 below the levels that produced today's senior class.
Indiana's fertility rate of 59.1 births per 1,000 women ages 15-44 still exceeds the national rate of 53.8, but has fallen 15% since 2007. Had pre-recession fertility rates persisted, Indiana would have had roughly 151,000 additional births over the past 16 years, enough to fill every kindergarten classroom in the state for two full years.
A gradient from PK to 12th grade
The grade-by-grade picture reveals a clear gradient. Kindergarten and first grade have each lost 9.3% of enrollment since 2016. The losses taper through the middle grades, with fifth through eighth grade each down just 1% to 2%. Then the pattern reverses: 11th grade is up 1.2% and 12th grade is up 13.4%.
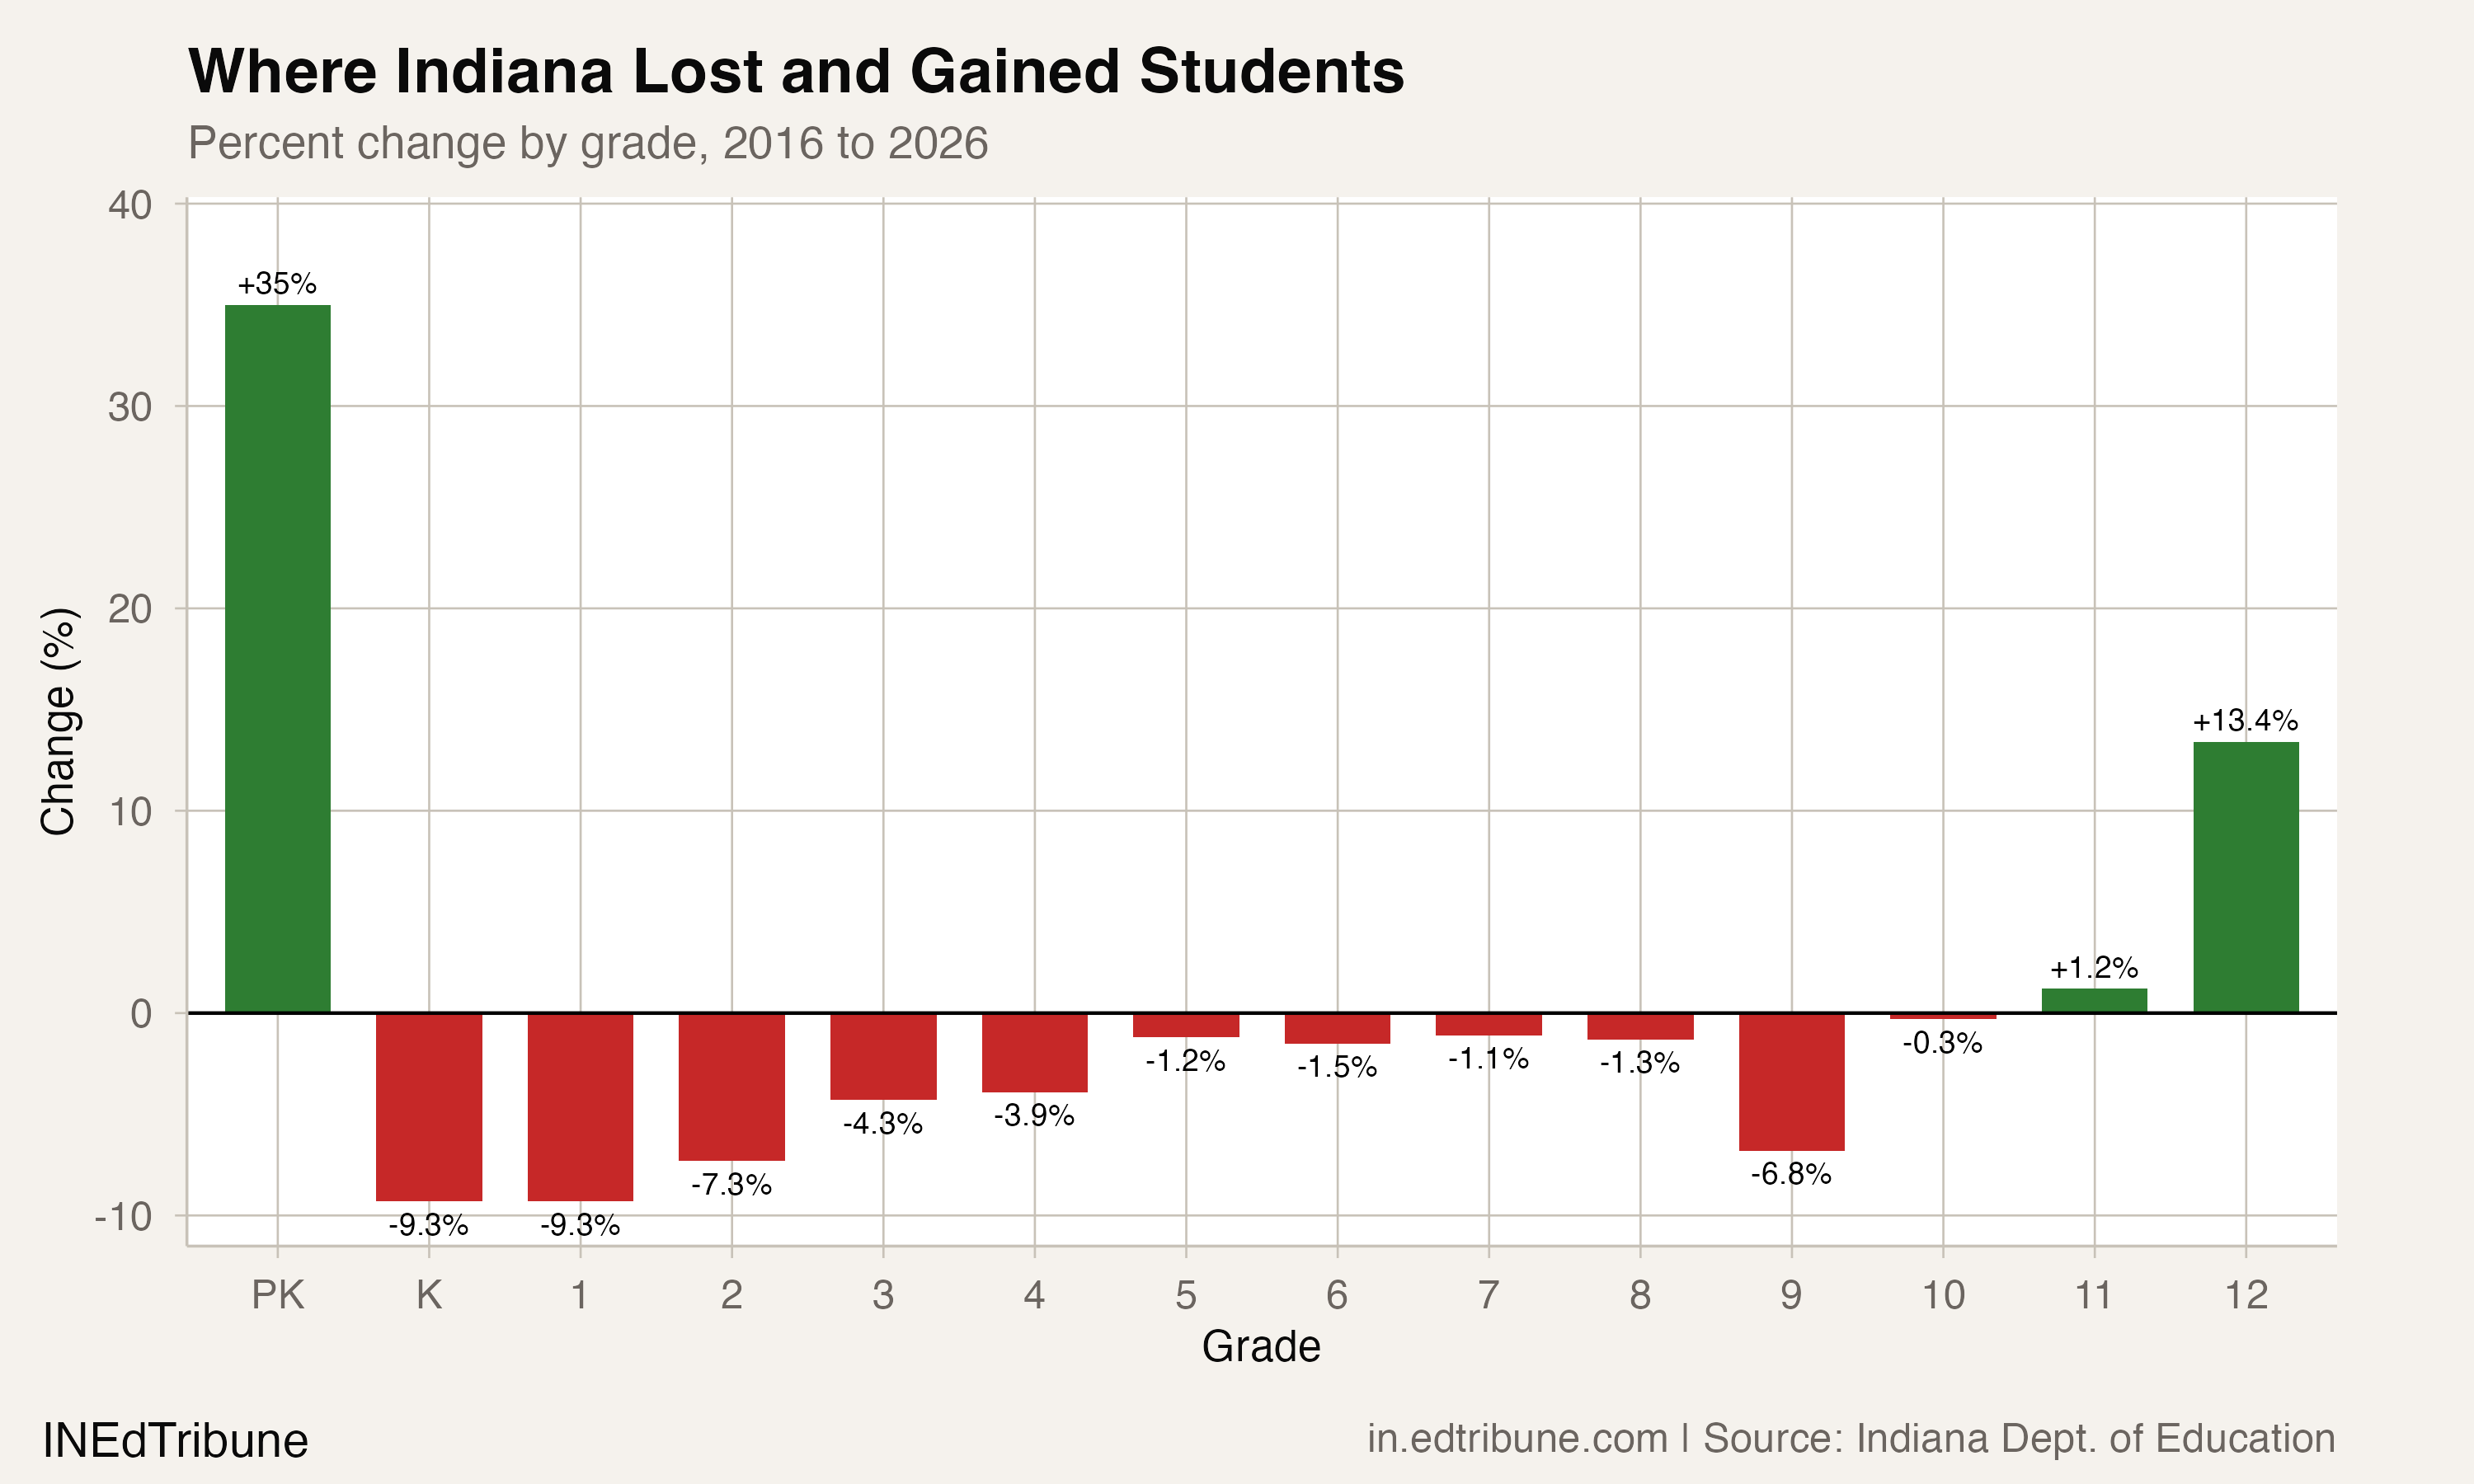
The exception to the downward gradient is pre-kindergarten, which grew 35.0% over the decade, from 18,530 to 25,022 students. Indiana's On My Way Pre-K program has expanded access for low-income families since 2015, and the growth in PK enrollment reflects program expansion rather than population growth. The PK surge does not feed into kindergarten gains because PK participation was already uncounted in earlier years.
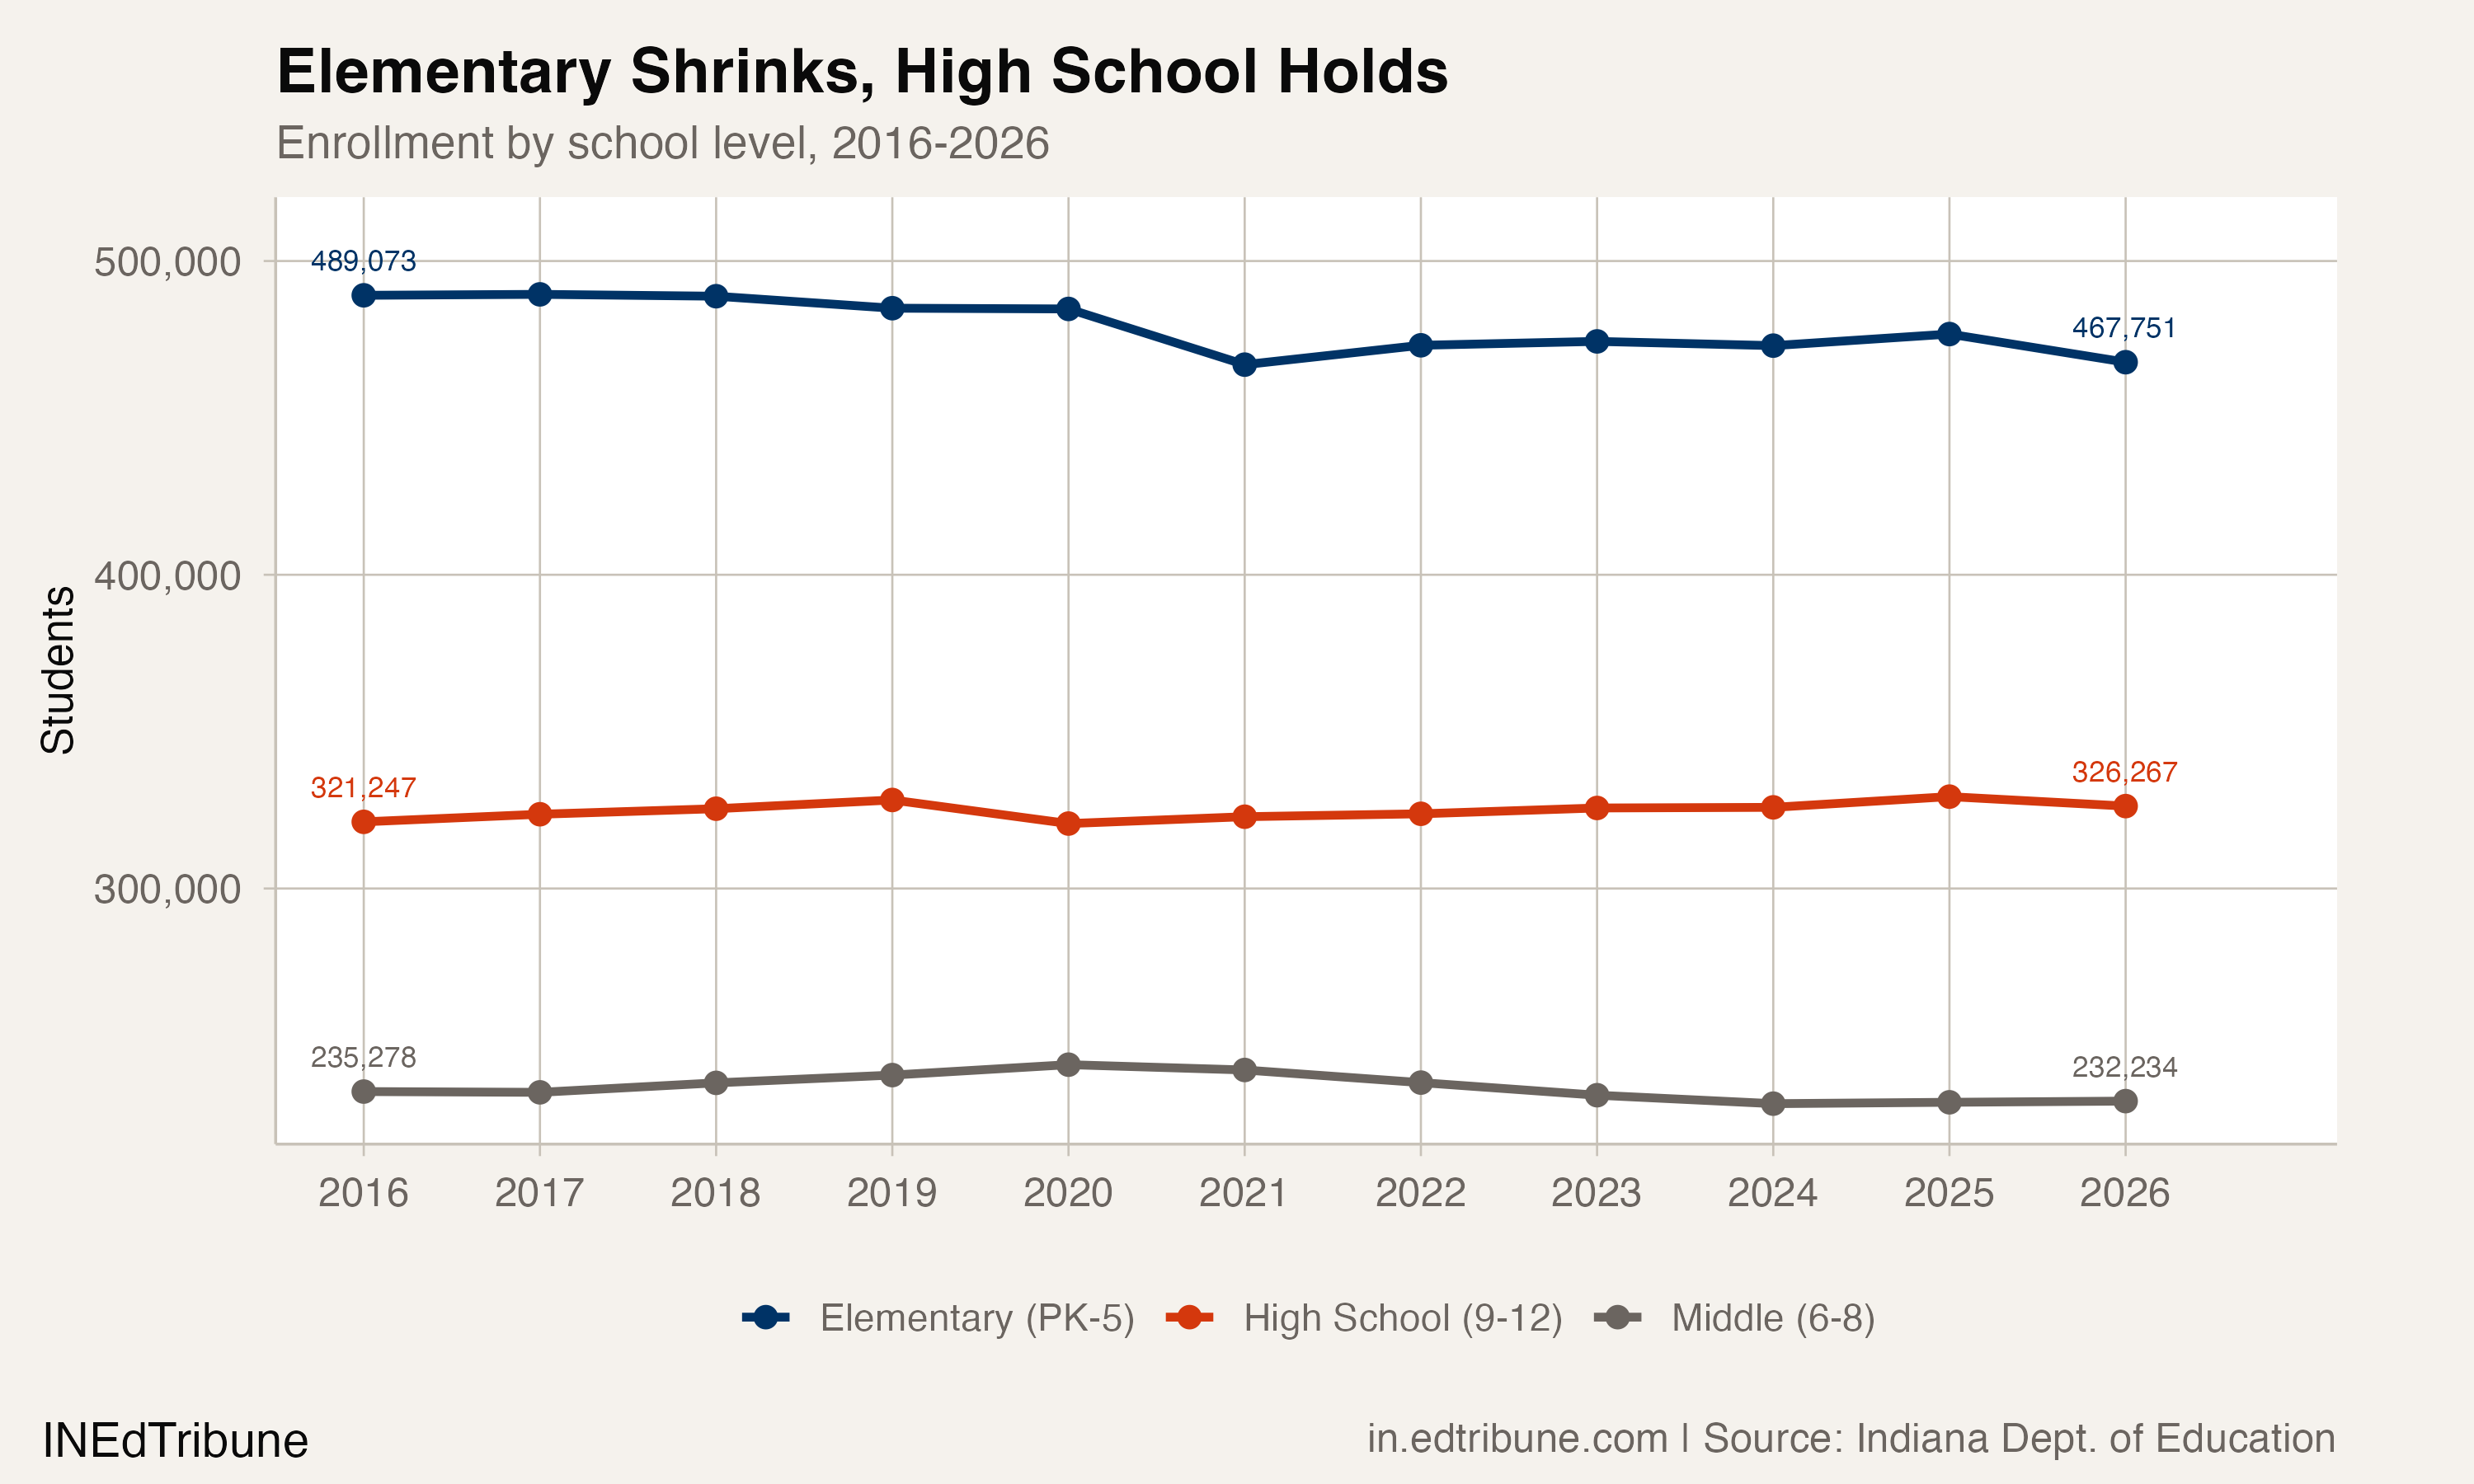
Elementary enrollment (PK through fifth grade) has dropped from 489,073 to 467,751, a 4.4% decline. High school enrollment (ninth through 12th grade) has grown 1.6%, from 321,247 to 326,267. Middle school has been relatively stable, down 1.3%.
What happens when the smaller cohorts arrive
The gap between kindergarten and 12th grade enrollment is not just a symbolic measure. It represents the difference between the students entering the system and the students leaving it. In 2026, that gap reached -15,157, the largest deficit in the data window and nearly triple the -5,542 gap recorded just three years earlier.
Indiana's total enrollment hit a recent peak of 1,055,354 in 2018-19 and has since fallen to 1,028,466, a loss of 26,888 students. The 2025-26 decline of 11,724 students was the second-largest single-year drop of the past decade, trailing only the pandemic plunge of 17,270 in 2020-21.
The pipeline inversion makes continued decline near-certain absent a major reversal in birth trends or migration patterns. Today's kindergarten class of 69,849 will not reach 12th grade until 2038. Every year between now and then, the graduating class will be drawn from larger birth cohorts than the entering kindergarten class. Even if birth rates stabilized tomorrow, the enrollment declines are pre-loaded.
The geographic distribution of the impact will be uneven. Indiana University's population projections show the state's under-20 population declining 4% by 2050, but rural counties will lose 16% of their school-age residents while suburban Indianapolis counties like Hamilton, Hendricks, and Boone each grow more than 20%. Sixty-seven of Indiana's 92 counties are projected to lose population outright.
"Indiana has already seen a decline in the size of its school-age population since 2010, and our latest population projections show that this slide will likely continue over the coming decades." — Indiana Business Research Center, 2024
A 2025 IU policy report found that 199 of Indiana's school corporations experienced net enrollment losses between 2006 and 2024, with an average decline of 174 students. Gary Community School Corporation lost 75% of its enrollment. Indianapolis Public Schools lost 43%. The pipeline inversion will compound these losses as the smaller incoming cohorts hit districts that are already shrinking.
The voucher question this data cannot answer
Indiana's Choice Scholarship program enrolled more than 76,000 students in 2024-25, spending $497 million in taxpayer-funded vouchers, with 70% of participants having no record of prior public school attendance. Starting July 2026, Indiana will eliminate all income requirements, opening the program to every family in the state.
The pipeline inversion data cannot isolate the voucher program's effect on kindergarten enrollment because the IDOE enrollment counts cover public school corporations and charters only. If families are choosing private schools at kindergarten entry rather than later, some portion of the kindergarten shortfall relative to birth cohort size could reflect school choice rather than demographic decline. The available data does not distinguish between the two.
What the data does show is that the 11th-to-12th grade transition rate exceeding 100% for four consecutive years suggests public high schools are retaining students through graduation at higher rates than in the past. The pipeline is losing students at the front door and holding them longer at the back.
The timing mismatch inside every school building
The kindergarten class of 2027-28, born during the deepest trough of the COVID baby bust, will likely set a new low. If Indiana follows national birth patterns, the 2021 birth cohort entering kindergarten in two years will be 5% to 8% smaller than the current class. A kindergarten enrollment below 67,000 is plausible. With graduating classes exceeding 83,000 and entering classes below 70,000, net losses of 10,000 or more per year are the new baseline.
But the pipeline inversion does not hit every floor of a school building at the same time. Elementary wings are emptying now. Middle schools will feel it in three to five years. High schools, still full of the larger birth cohorts from the early 2010s, will not start shrinking until the end of the decade. A superintendent closing an elementary wing in 2027 cannot repurpose those rooms for high school students who will not arrive for years. The mismatch creates a period where districts are simultaneously managing overcrowded high schools and half-empty elementary buildings, paying to heat and maintain both. That awkward middle period is where Indiana finds itself right now, and it will last the rest of the decade.
Detailed code that reproduces the analysis and figures in this article is available exclusively to EdTribune subscribers.
Discussion
Sign in to join the discussion.
Loading comments...