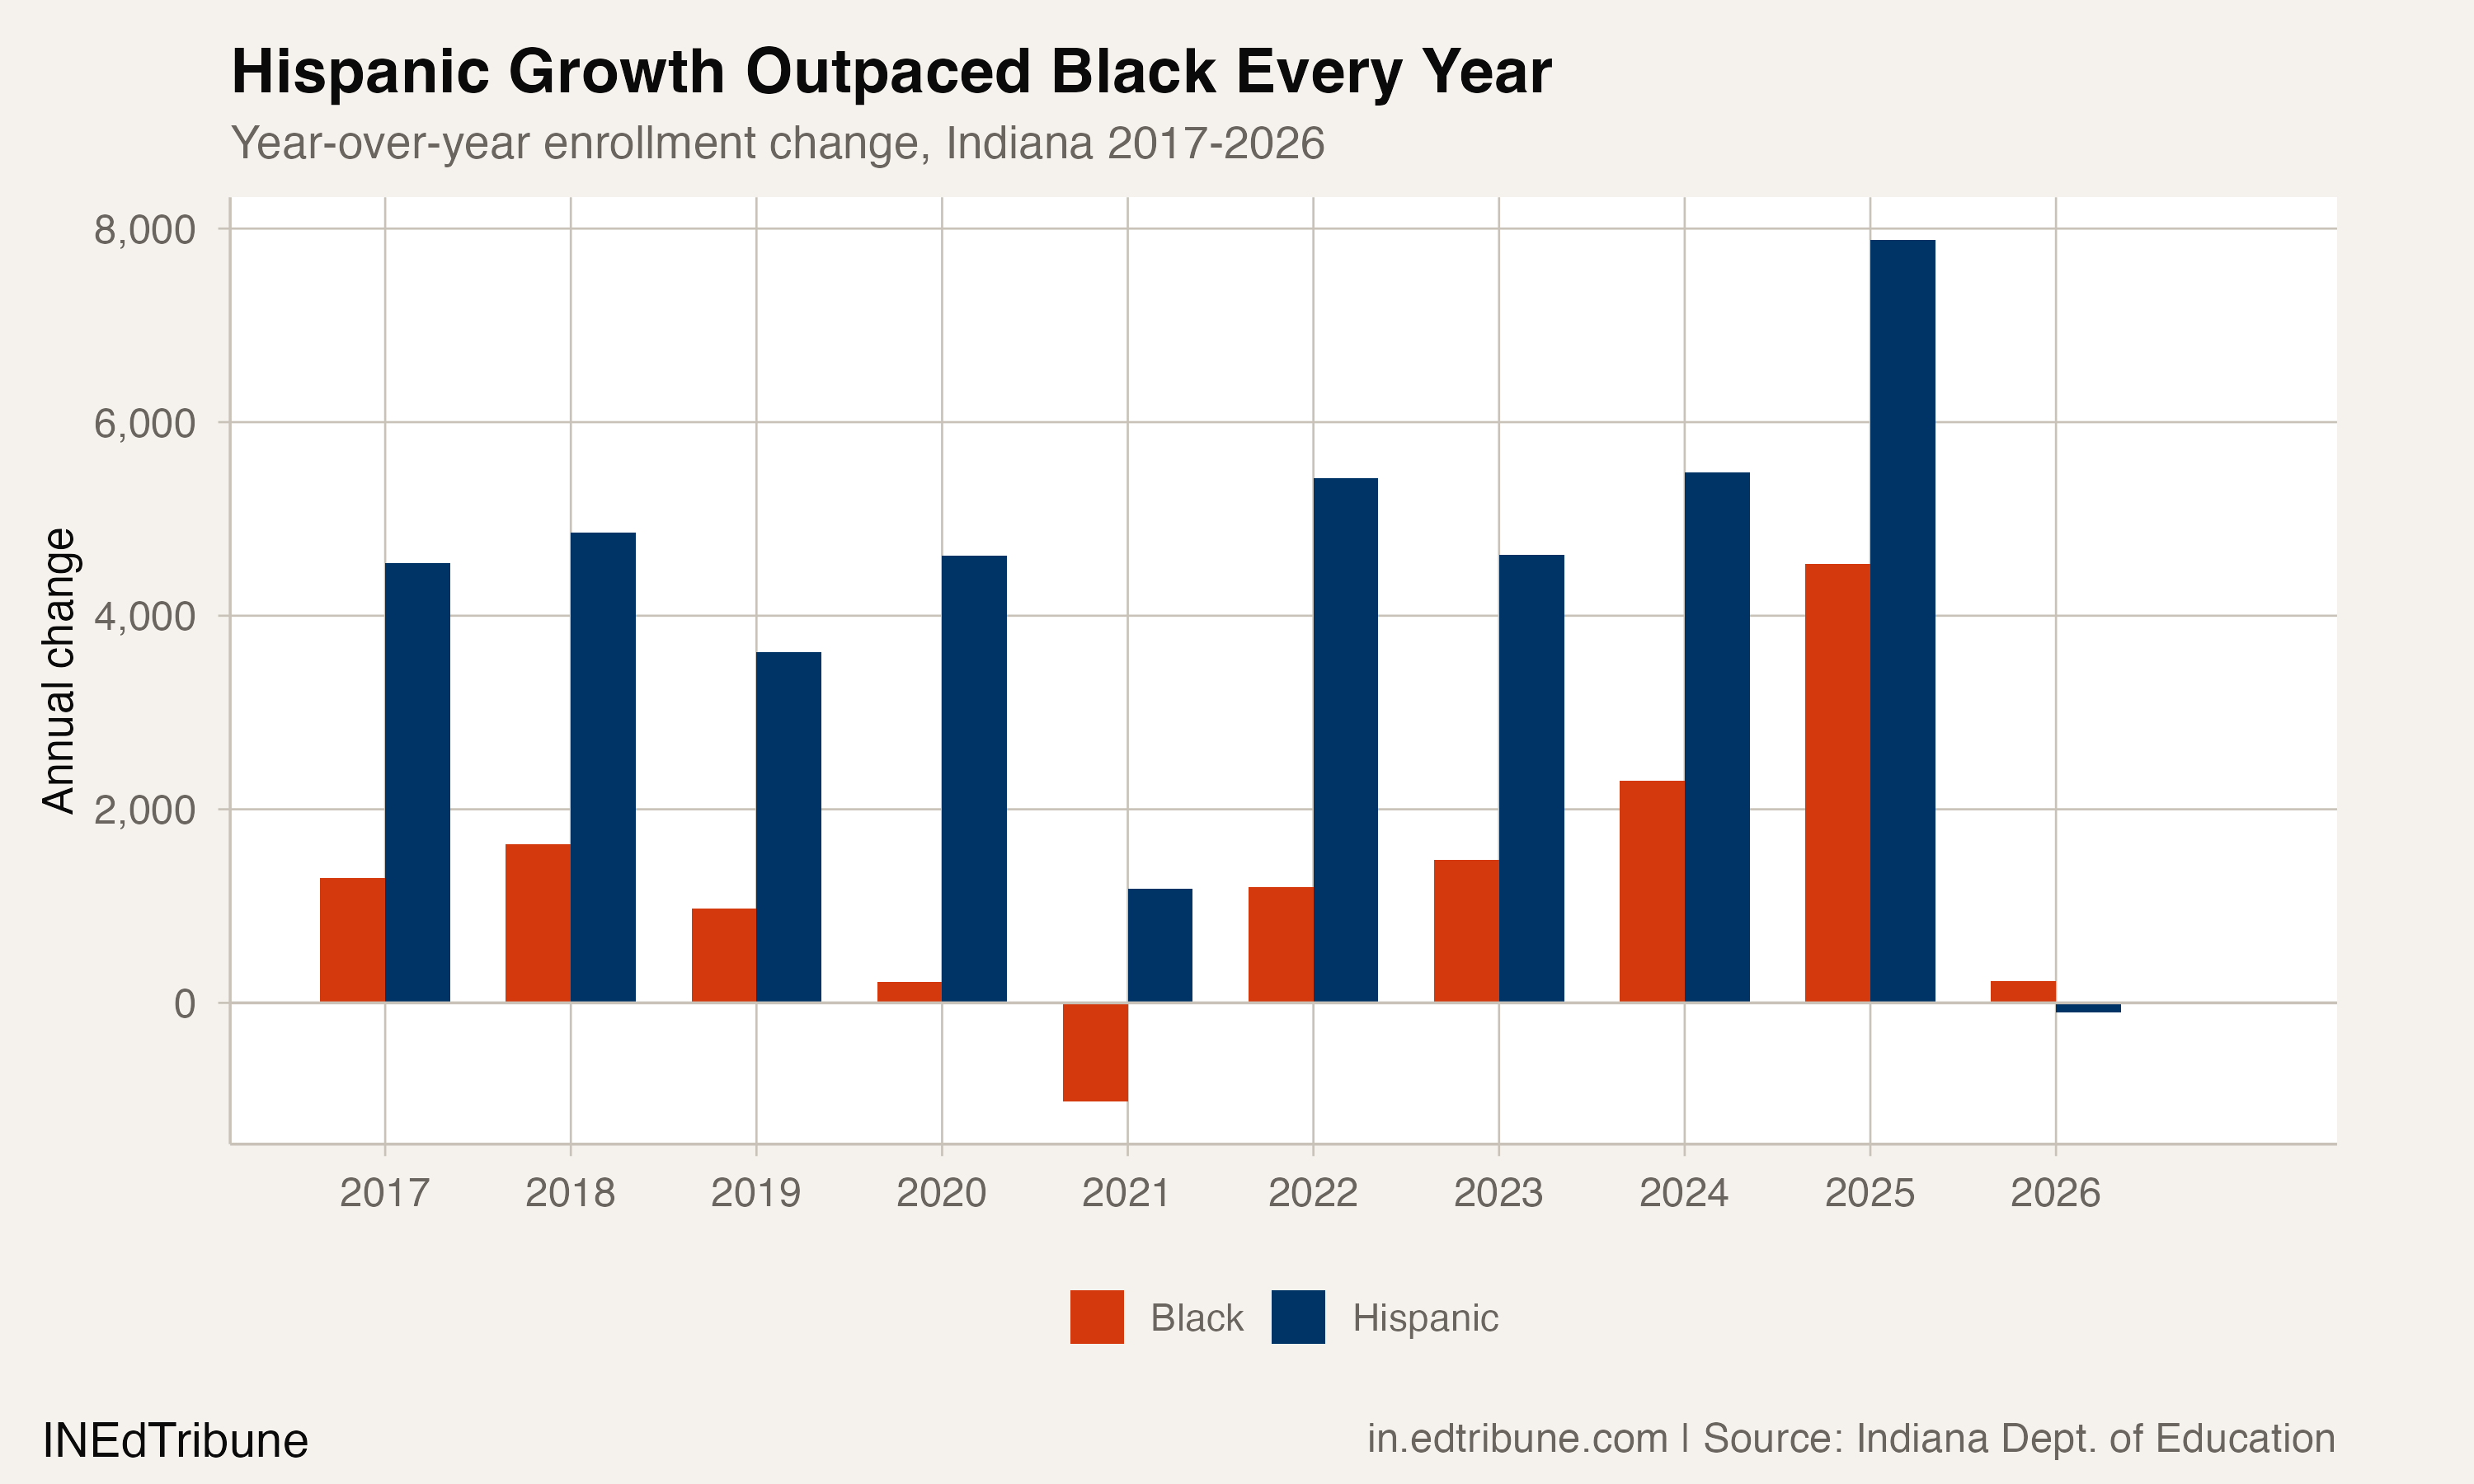
For nine consecutive years, Indiana's Hispanic student population grew. It grew through a pandemic, through a national enrollment crisis, through a decade in which the state's total enrollment fell by 18,061 students. Hispanic enrollment added 42,137 students over that span, a 36.1% increase that reshaped Indiana's demographic profile more than any other single trend.
Then, in 2025-26, the growth stopped. Hispanic enrollment fell by 102 students, the first decline in the dataset.
The crossover and its context
Hispanic students surpassed Black students as Indiana's largest minority group in 2019-20, when 134,319 Hispanic students edged past 133,932 Black students by a margin of just 387. The crossover had been visible for years: the gap between the two groups narrowed from 13,138 in 2016 to 4,015 in 2019, closing at a rate of roughly 3,000 students per year.
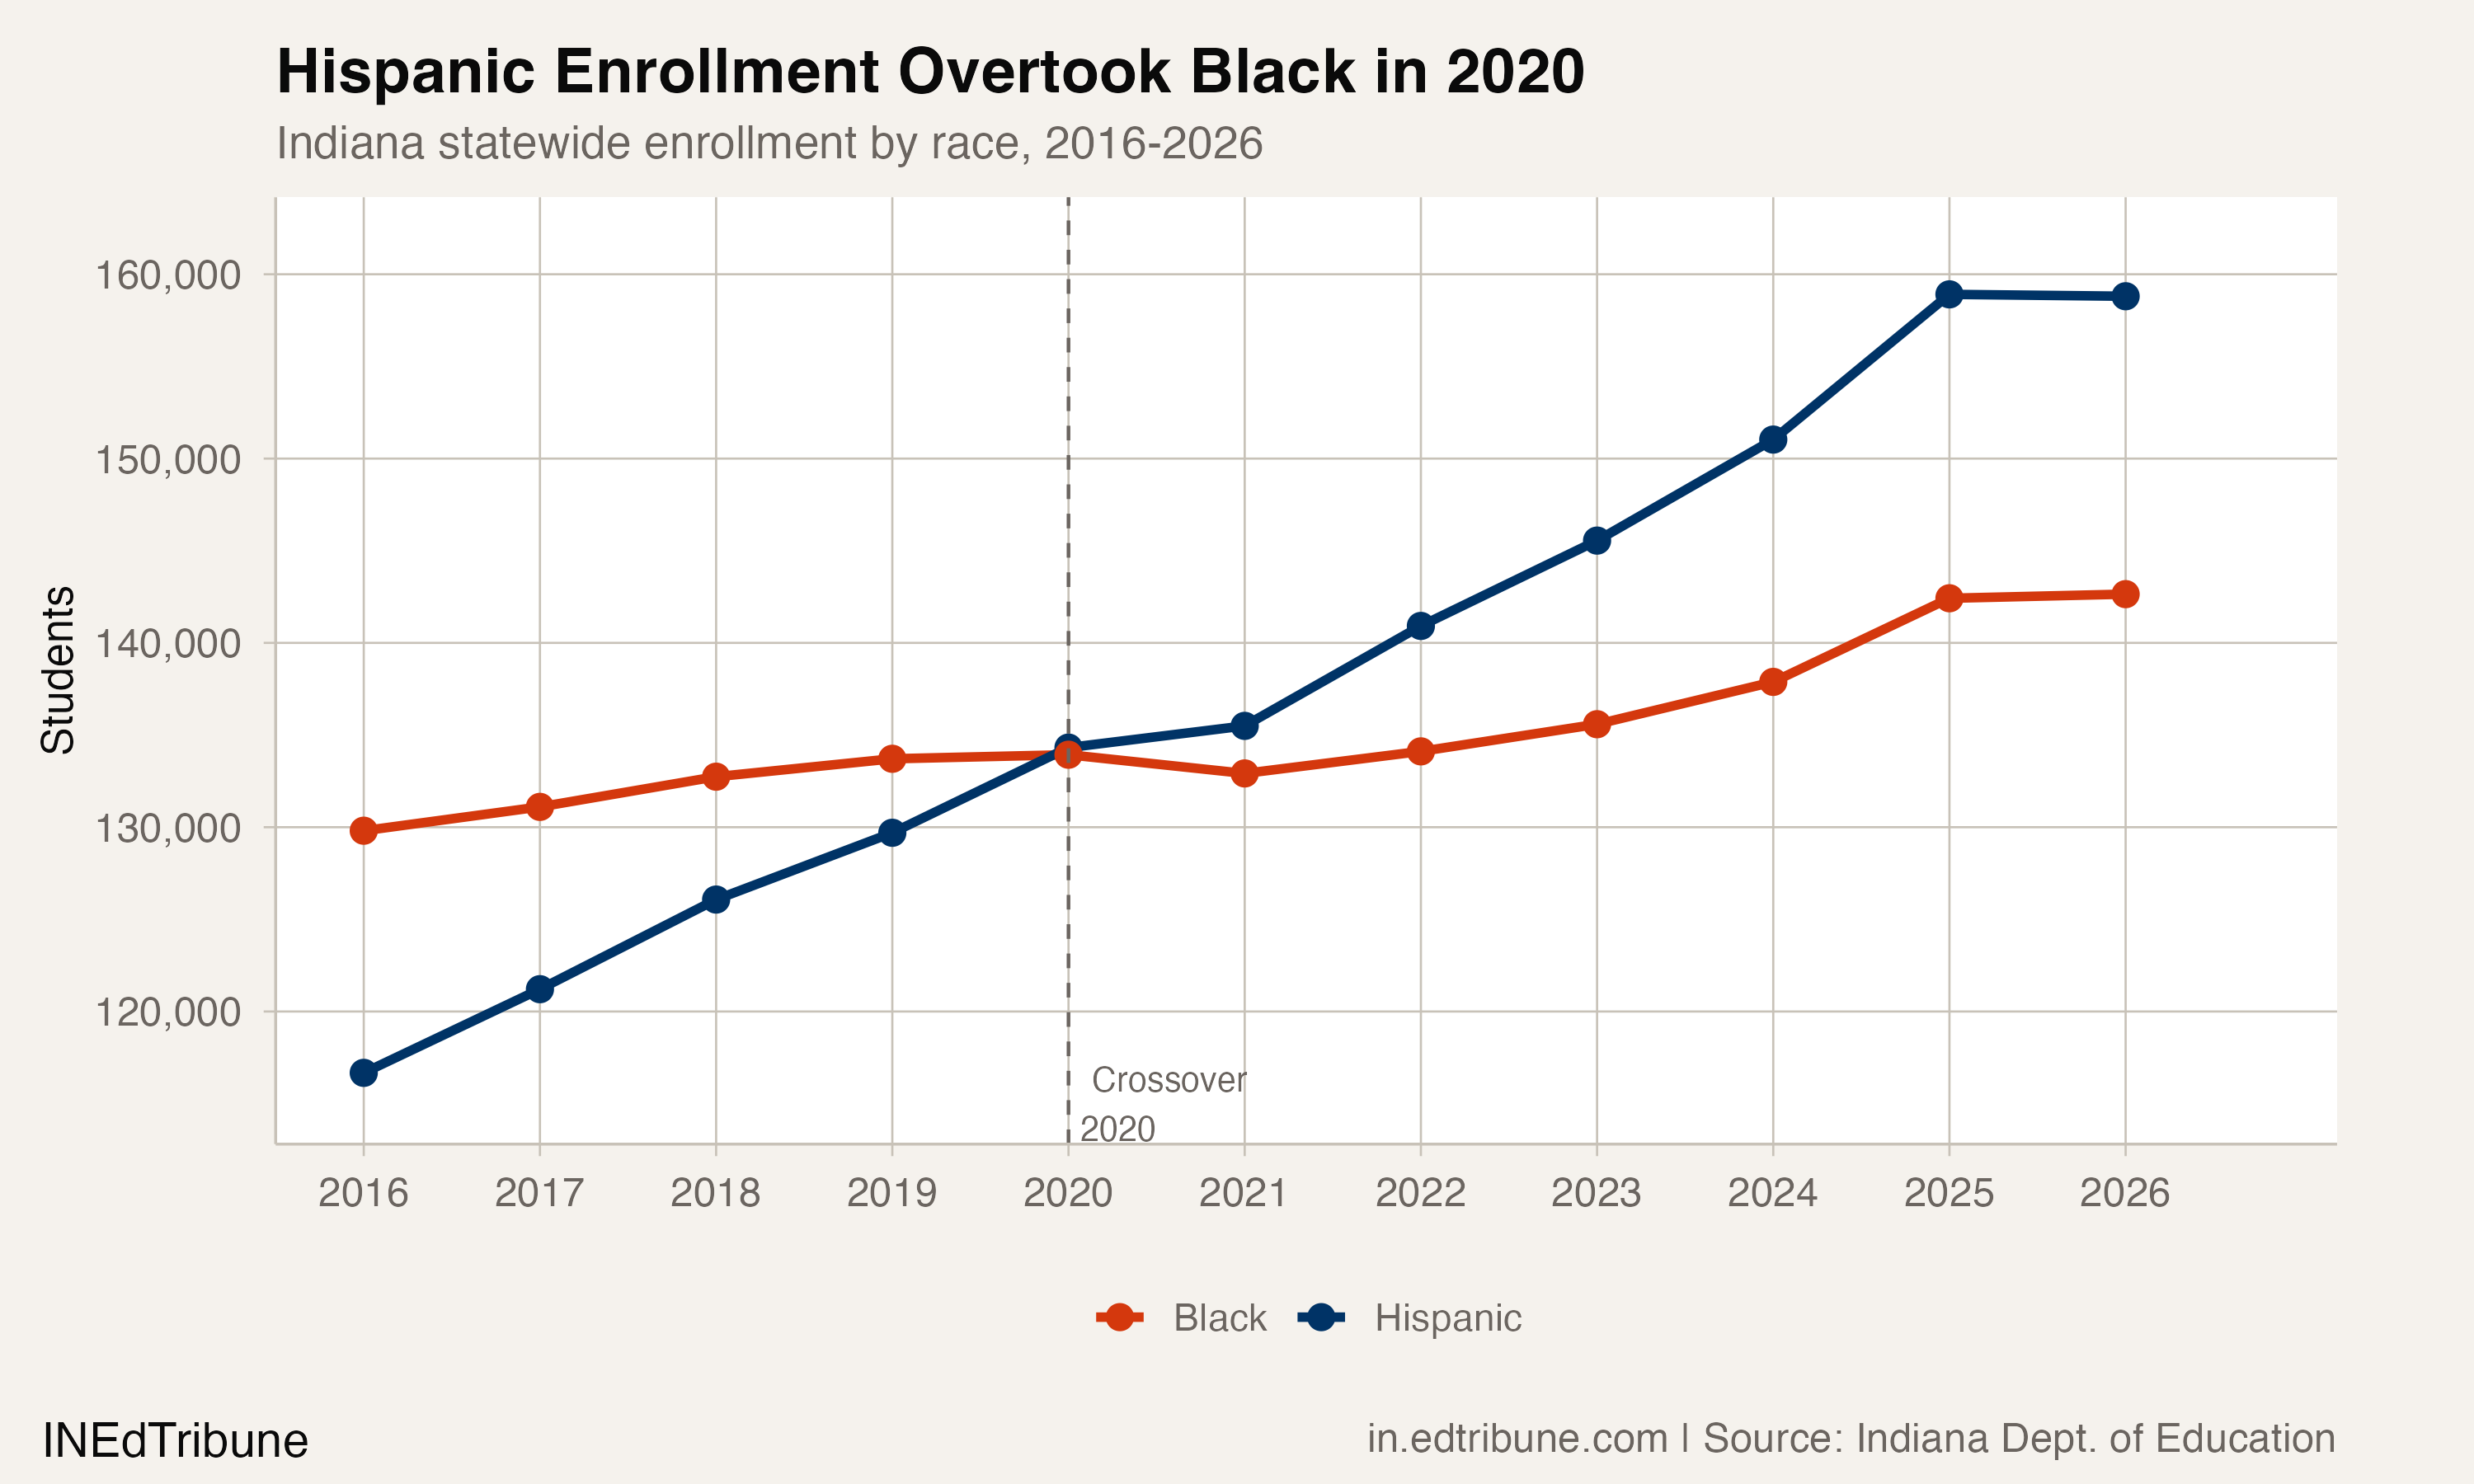
By 2025-26, the gap had widened to 16,163. Indiana now enrolls 158,808 Hispanic students and 142,645 Black students. Hispanic students account for 15.4% of the state's enrollment, up from 11.1% a decade ago. Black students account for 13.9%, up modestly from 12.4%.
The crossover reflects a broader national pattern. Indiana's Hispanic population grew 42.2% between 2010 and 2020, adding 164,484 residents, while the Black population grew 9.5%. That general-population trend arrived in schools with a roughly five-year lag, as children born during the growth years entered kindergarten.
Where the growth is concentrated
The growth is not uniform. It runs along two geographic corridors and is conspicuously absent from the places that already had large Hispanic populations.
The northern manufacturing belt, anchored by Elkhart and surrounding counties, has been attracting Latino workers to the recreational vehicle and auto parts industries for decades. Goshen Community Schools↗ET is now 57.8% Hispanic, with 3,474 Hispanic students in a district of 6,008. Fort Wayne Community Schools↗ET added 1,960 Hispanic students since 2016, the largest absolute gain of any district in the state, reaching 6,695.
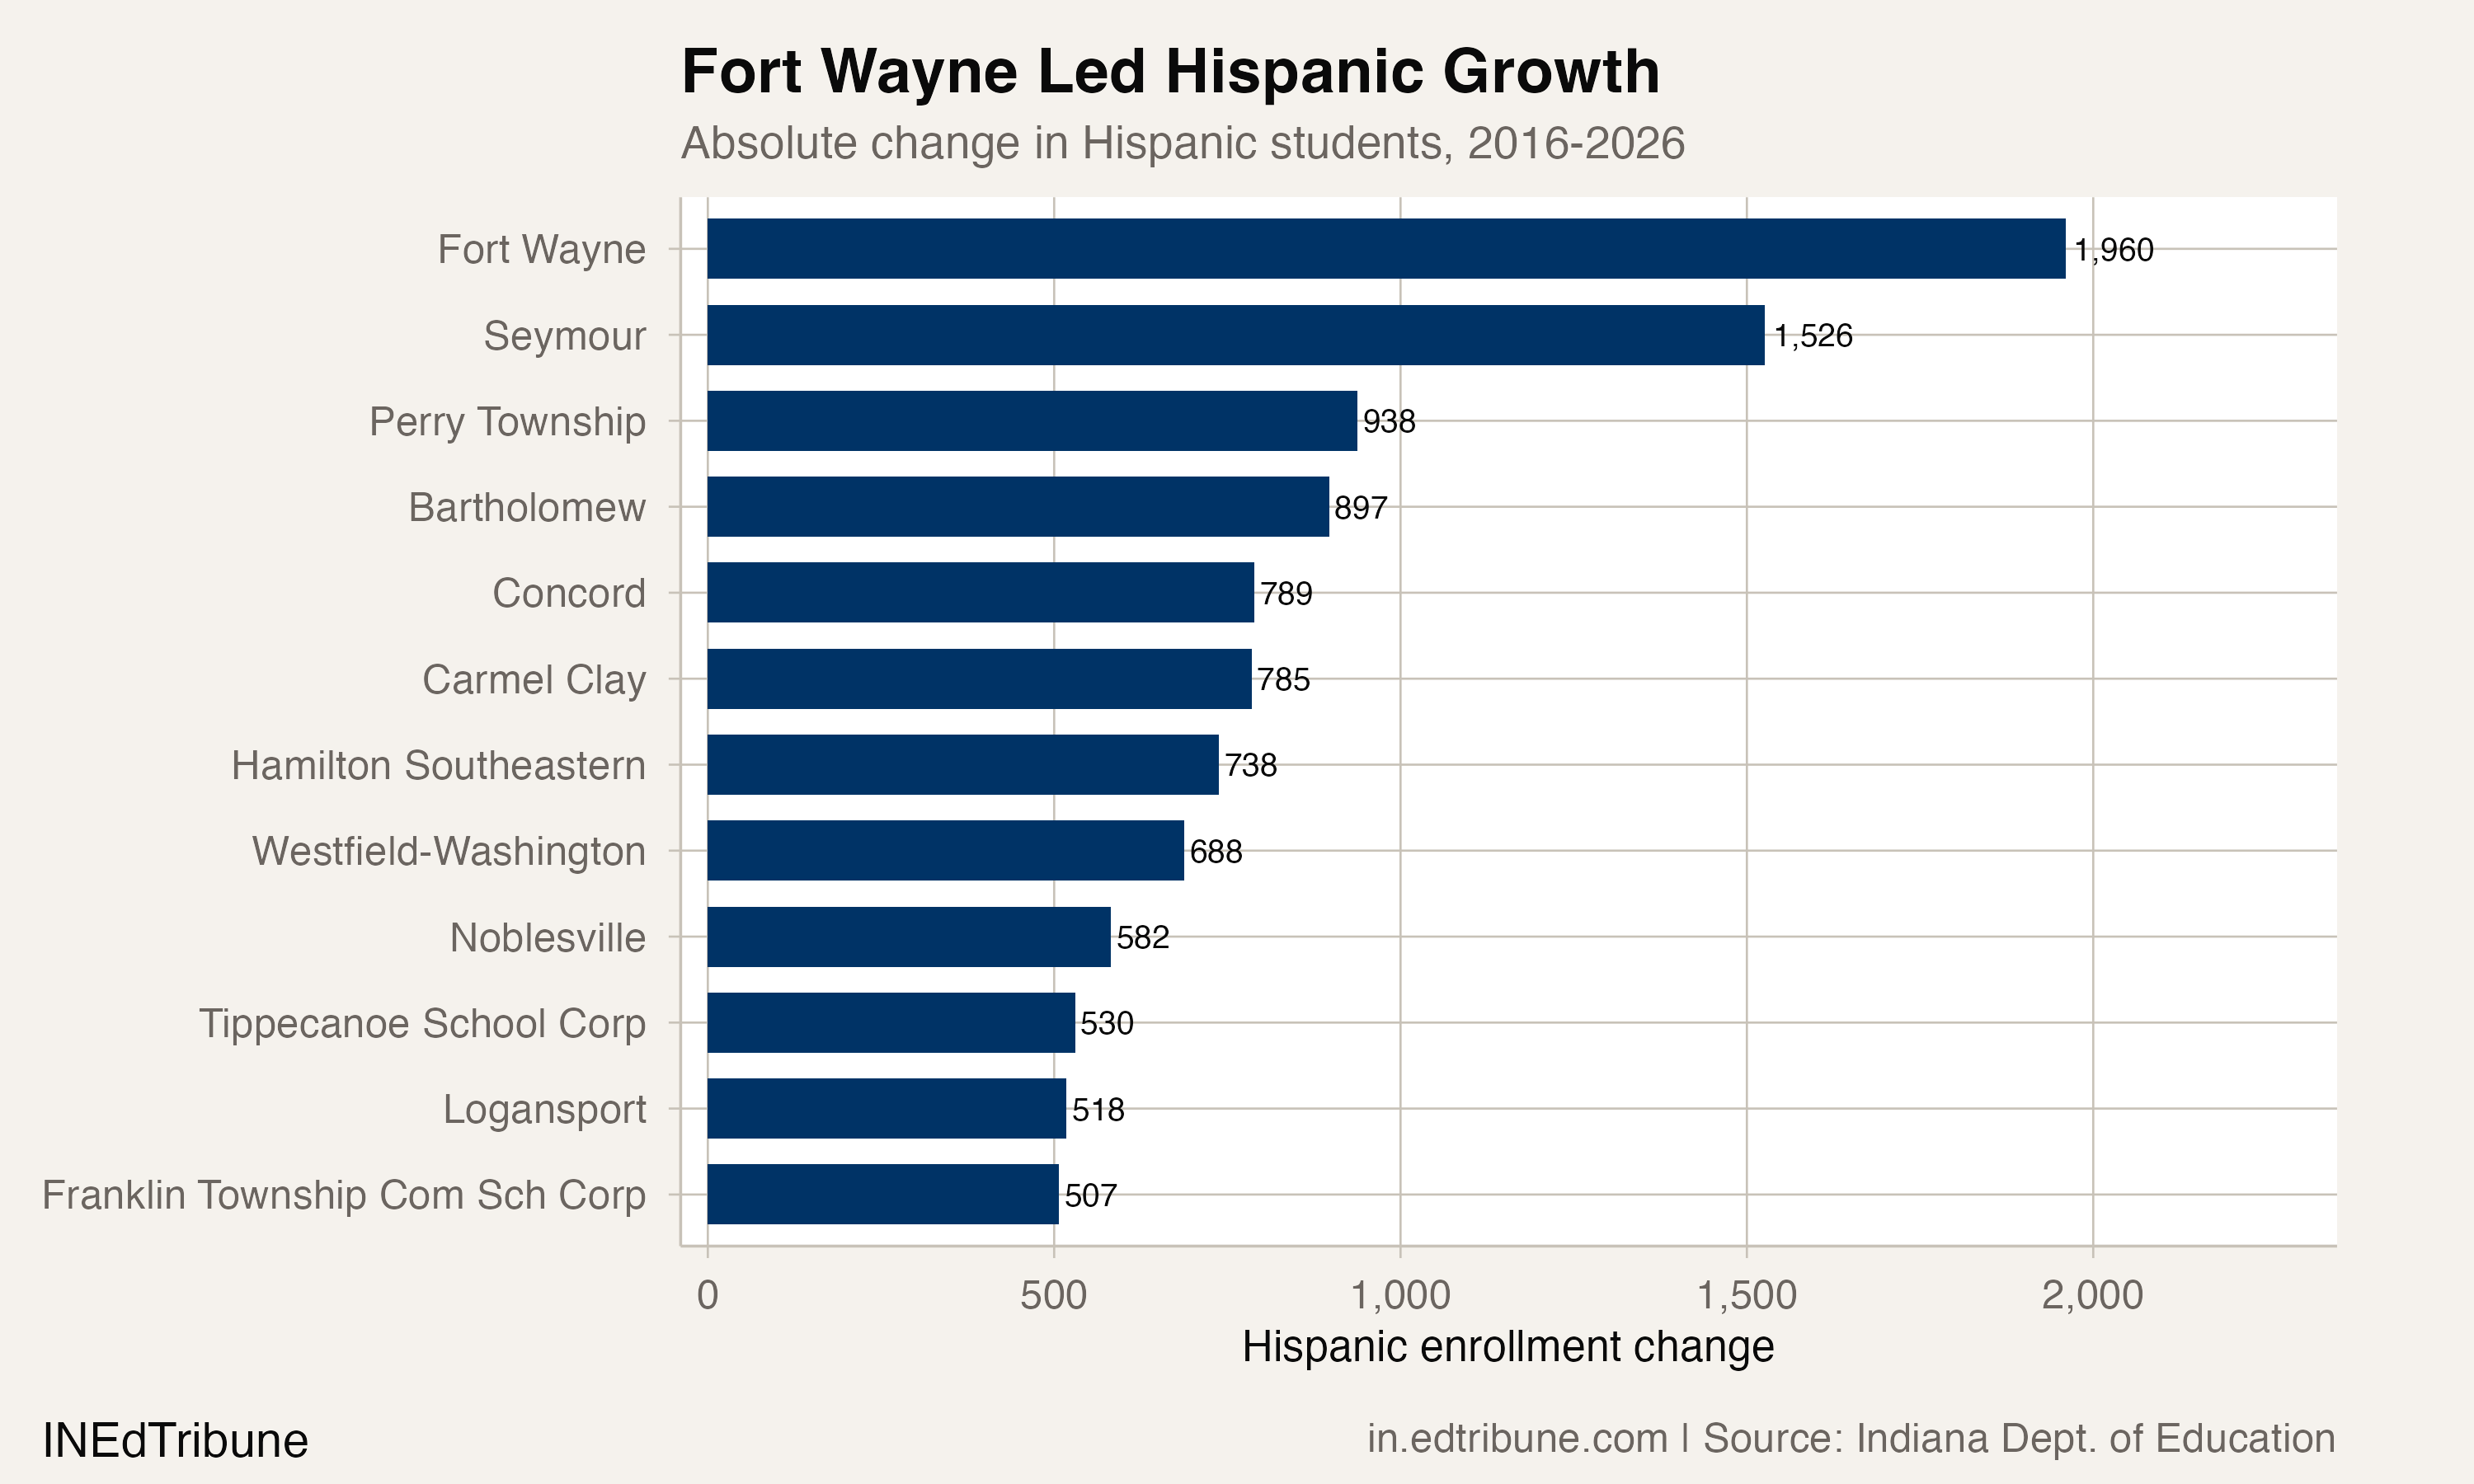
The second corridor runs through smaller cities in southern and central Indiana. Seymour Community Schools↗ET grew its Hispanic enrollment by 151.5%, from 1,007 to 2,533 students. Jackson County, where Seymour sits, saw a 159% increase in its Hispanic population between the 2010 and 2020 Censuses, the largest proportional shift of any Indiana county.
The most striking growth, however, is in the Indianapolis suburbs. Carmel Clay Schools↗ET added 785 Hispanic students since 2016, a 184.7% increase. Hamilton Southeastern Schools↗ET added 738 (+58.1%). Westfield-Washington added 688 (+125.1%). Noblesville added 582 (+103.0%). These are affluent, fast-growing districts in Hamilton County where Hispanic families are arriving alongside the broader suburban expansion, not replacing departing white families.
A 93,000-student rebalancing
The Hispanic crossover is one piece of a larger compositional shift. White enrollment fell from 725,492 to 631,886 since 2016, a loss of 93,606 students. The white share of enrollment dropped from 69.3% to 61.4%, a decline of 7.9 percentage points in a decade.
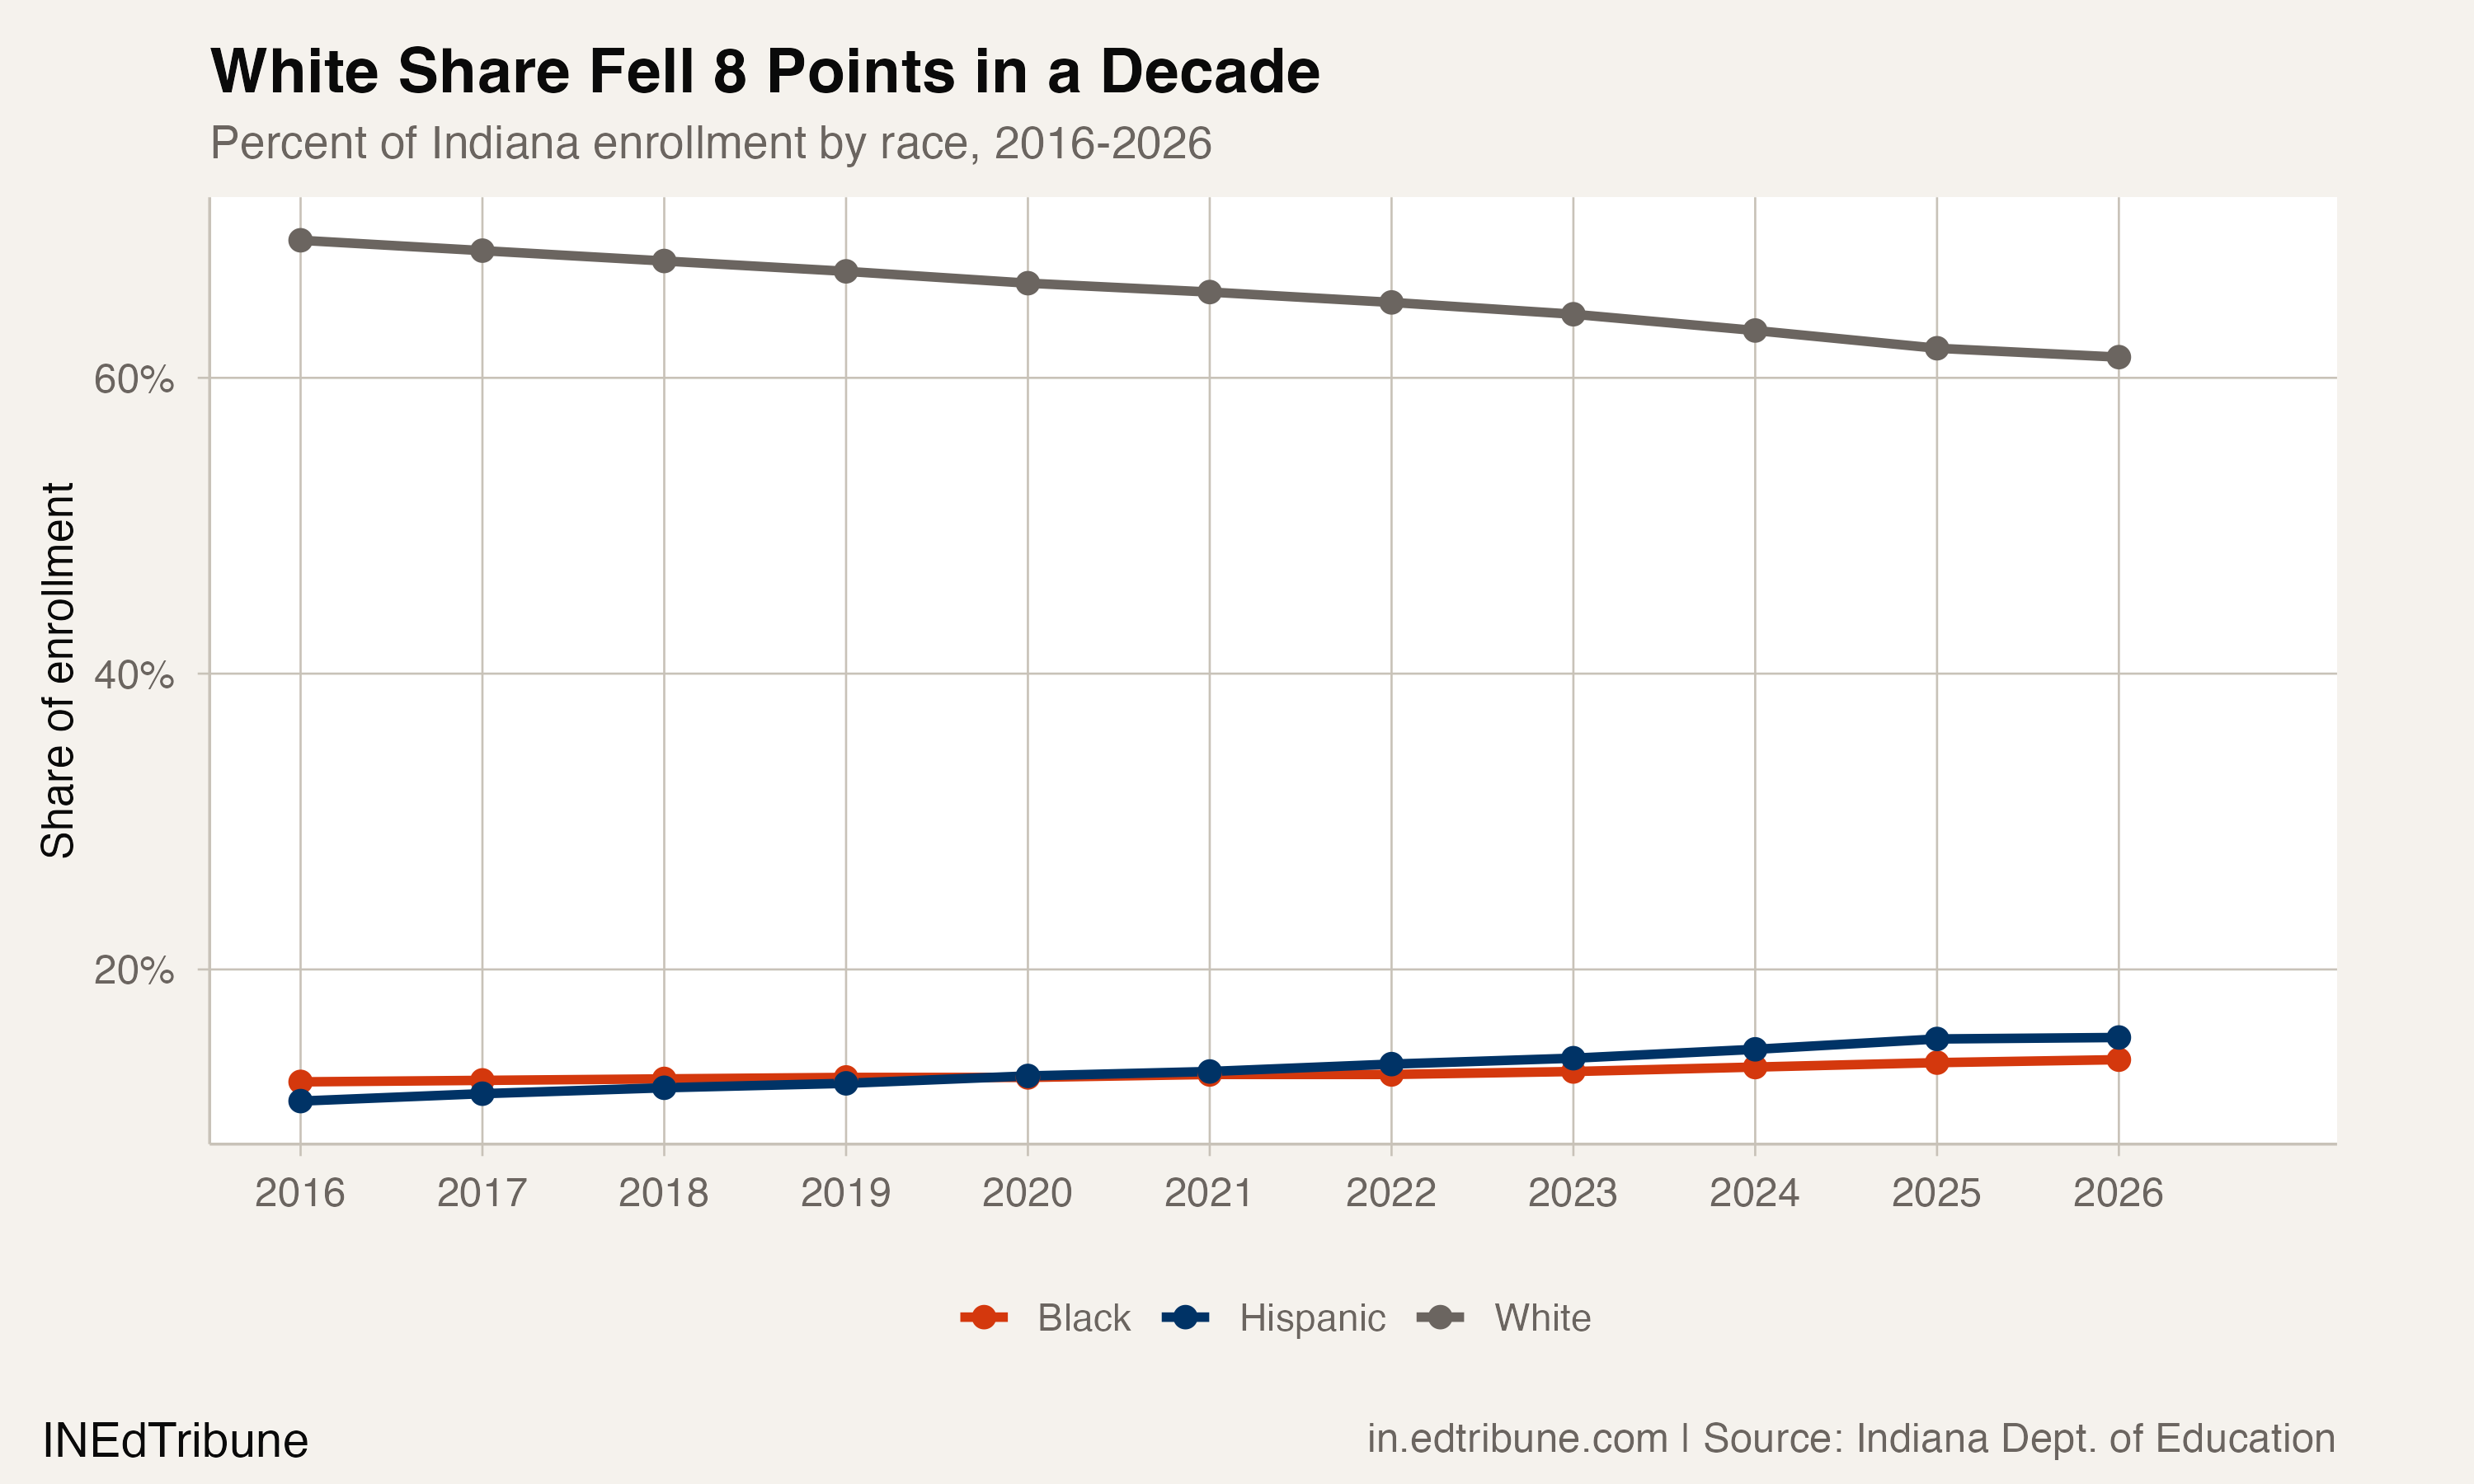
Every non-white group grew. Asian enrollment rose 48.7% (+10,964). Multiracial enrollment rose 20.1% (+9,861). Black enrollment rose 9.9% (+12,836). But Hispanic enrollment's 36.1% growth (+42,137) accounted for more new students than all other non-white groups combined.
The net effect: Indiana lost 18,061 total students since 2016, a 1.7% decline. Without Hispanic growth, that decline would have been 60,198, a 5.8% drop. Hispanic students are the demographic ballast holding Indiana's enrollment numbers closer to stable.
The share gap tells a different story
In absolute numbers, the Hispanic-Black gap is large and growing. In share terms, the story is subtler.
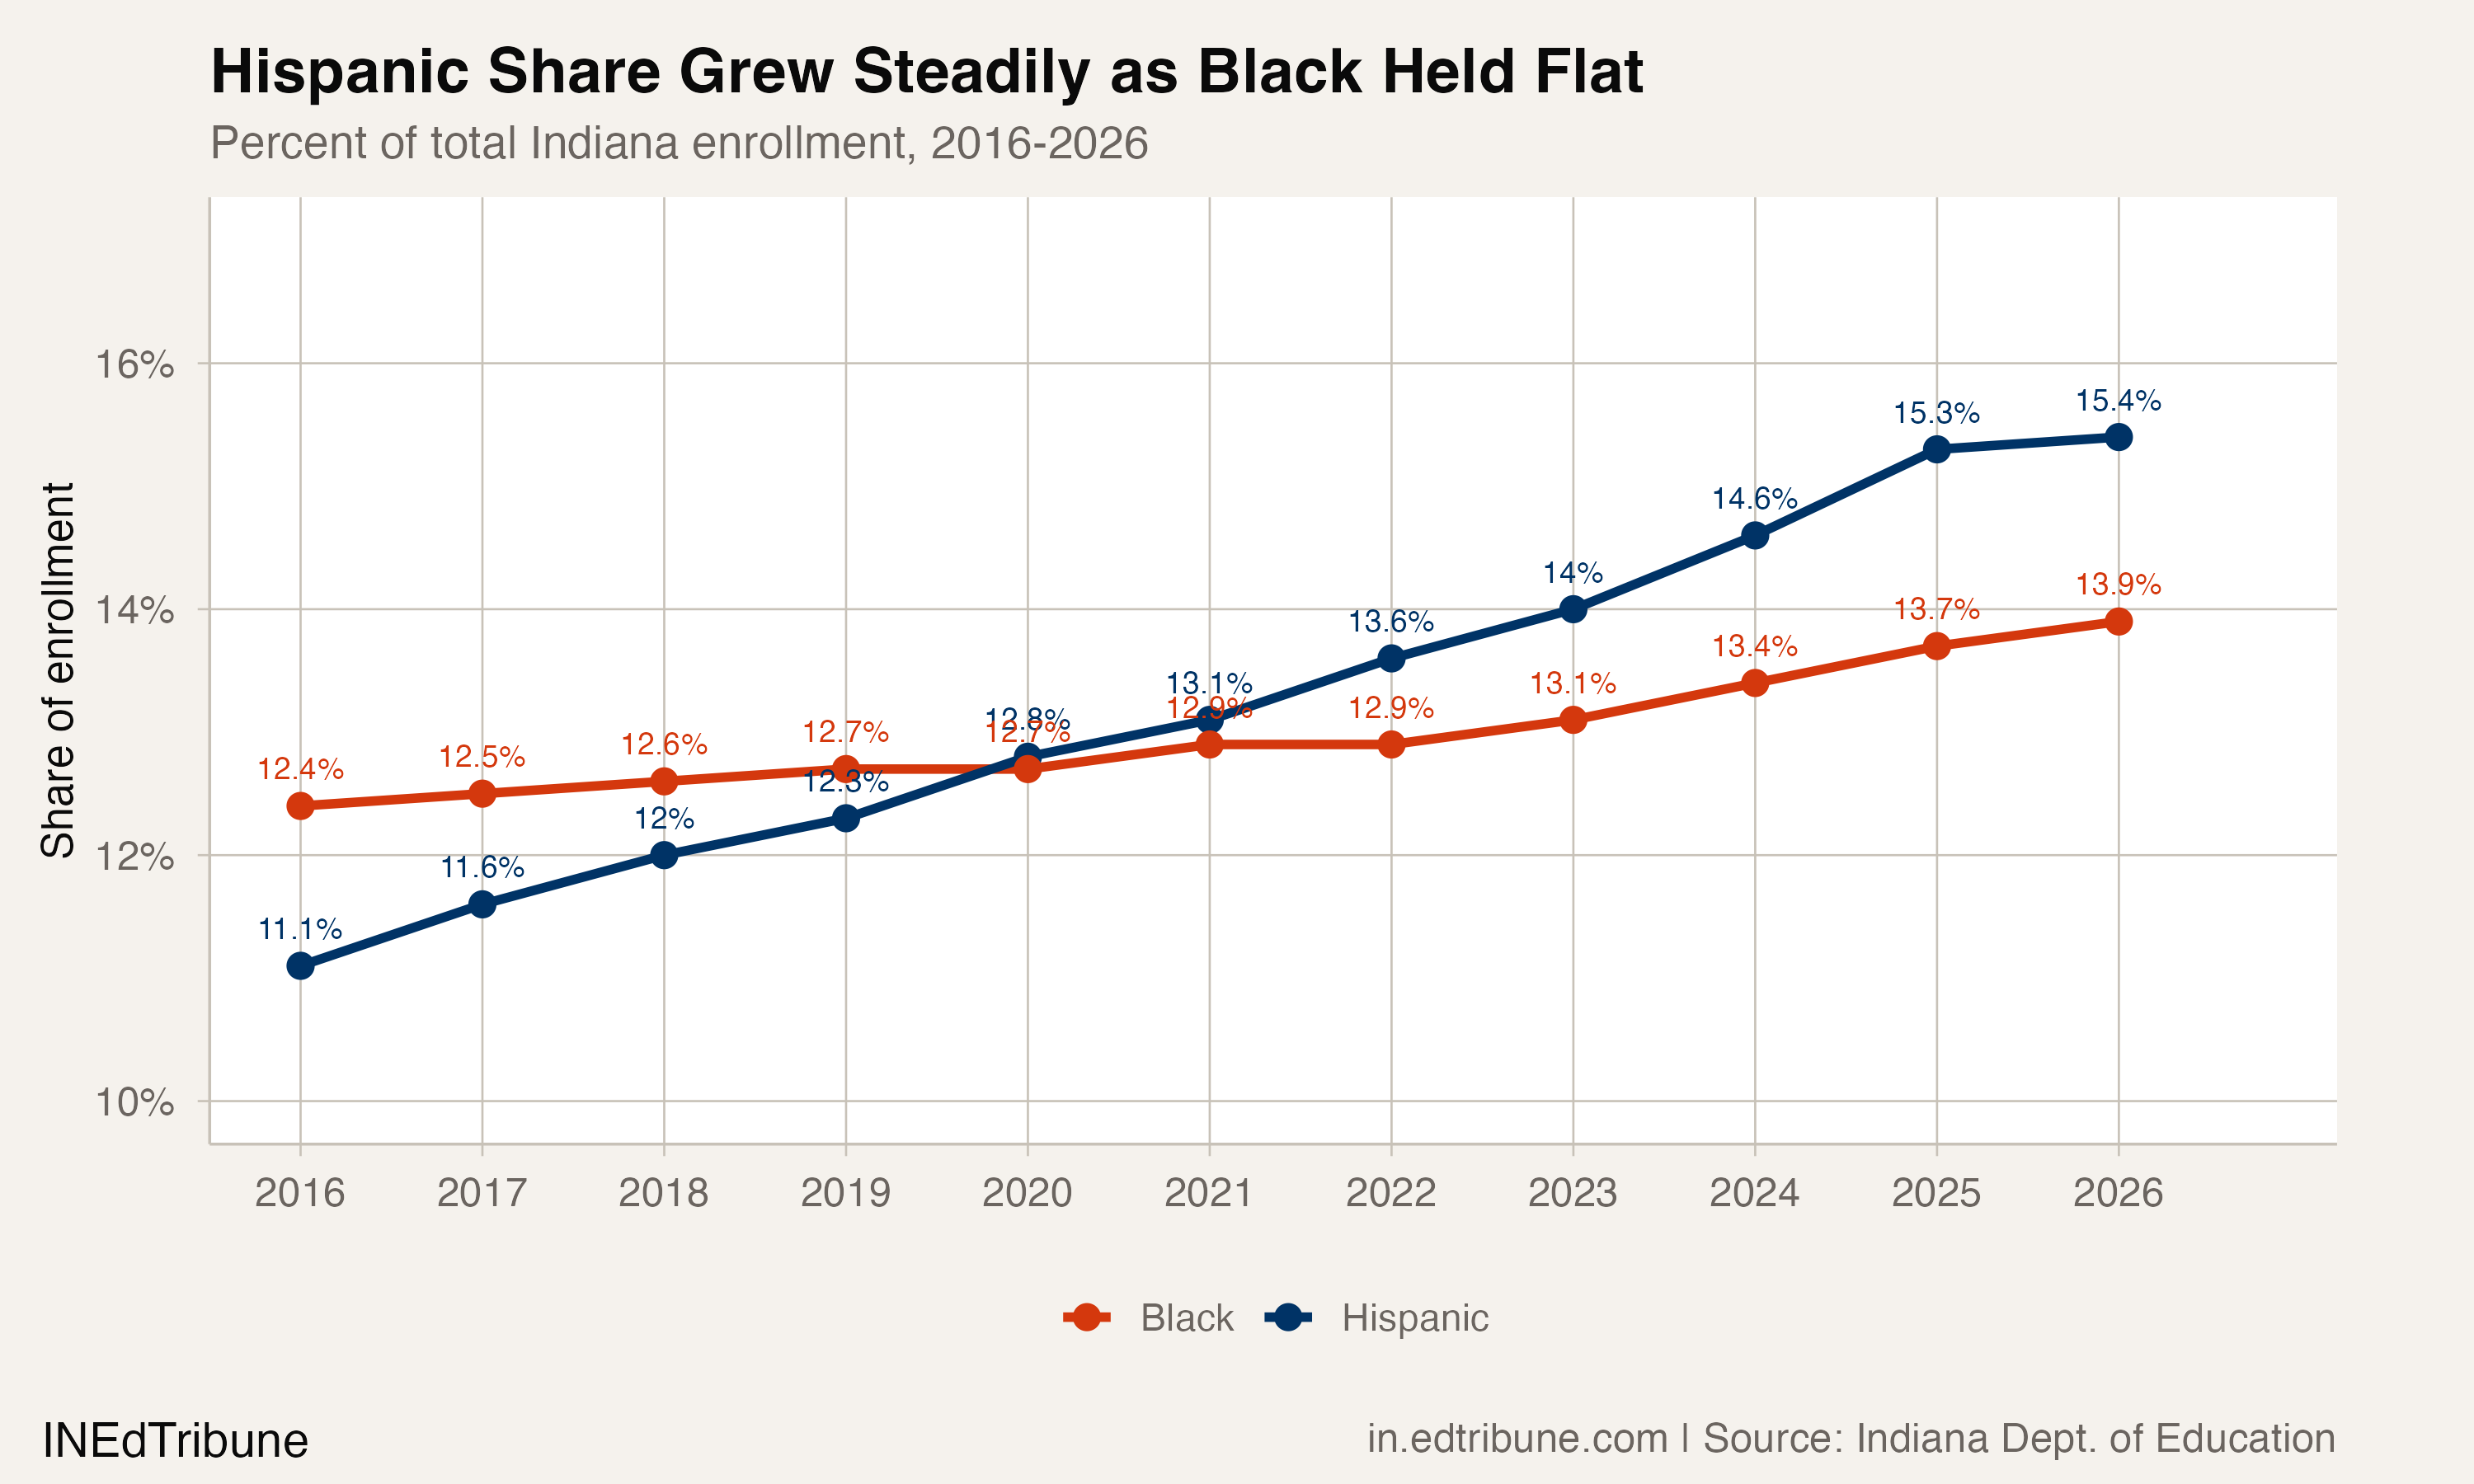
Hispanic share rose 4.3 percentage points in a decade, from 11.1% to 15.4%. Black share rose 1.5 points, from 12.4% to 13.9%. Part of the Black share increase reflects the denominator shrinking as white enrollment fell. In absolute terms, Black enrollment grew by 12,836 students, with most of that growth concentrated in 2024 and 2025 (a combined gain of 6,833). That two-year surge warrants its own investigation.
A sudden stop
The 2025-26 data contains a discontinuity. After adding 7,879 Hispanic students the prior year, the largest single-year gain in the dataset, Indiana's Hispanic enrollment fell by 102. It is the first year-over-year decline in the 11-year trend window.
The district-level data reveals where the losses originated. Indianapolis Public Schools↗ET lost 488 Hispanic students in a single year. School City of Hammond lost 421. Goshen lost 148. Elkhart lost 139. South Bend lost 107. These are districts with large, established Hispanic communities, not districts on the margins.
The timing coincides with a period of heightened federal immigration enforcement in Indiana schools. In January 2025, federal agents attempted to deport a Honduran father connected to IPS, triggering a legal confrontation between Attorney General Todd Rokita and the district. Rokita sued IPS over policies that restricted ICE access to schools. IPS subsequently removed resources for undocumented students from its website.
At the state level, SB 76, which prohibits governmental bodies from impeding federal immigration enforcement, advanced through the legislature in early 2026. The bill's scope includes school districts, though its practical requirements remain ambiguous.
"We are already seeing higher levels of school absenteeism and negative changes in school climate, student mental health and community trust." -- Indiana State Teachers Association, via Chalkbeat Indiana, Feb. 2026
Whether the 2026 Hispanic enrollment dip reflects families leaving the state, shifting to private or homeschool options, or simply not enrolling children who are still present is impossible to determine from enrollment data alone. The data shows a count. It does not show a reason. But a decade-long growth trend does not reverse by accident, and the reversal appeared simultaneously in geographically scattered districts with large Hispanic populations.
Nineteen districts, one threshold
Nineteen Indiana school corporations are now more than 50% Hispanic. Another 50 are between 25% and 50%. School City of Whiting, in Lake County, leads at 79.1%. These districts face a specific operational challenge: serving a student body where the majority speak a home language other than English, with instructional programs whose per-pupil costs exceed those of general education. Nationally, 69% of high schools reported difficulty filling ESL or bilingual education vacancies for the 2024-25 school year, according to the National Center for Education Statistics, making it one of the hardest subject areas to staff.
The districts where Hispanic enrollment grew fastest are not the state's poorest. Carmel, Hamilton Southeastern, Westfield, and Noblesville are among Indiana's most affluent districts. The pattern is not one of concentrated poverty. It is one of demographic diversification reaching places that, a decade ago, were overwhelmingly white.
One dip, two possible futures
The 2026 dip is a single data point. It could be a one-year anomaly driven by chilled enrollment during a period of enforcement anxiety, a statistical artifact of how enrollment snapshots capture a mobile population, or the start of something the data will take several more years to confirm.
What the data can say with confidence: Hispanic students added 42,137 to Indiana's enrollment over a decade in which total enrollment shrank. Without that growth, Indiana would have lost 60,198 students instead of 18,061. The districts absorbing that growth span the income spectrum, from Goshen's RV factories to Carmel's white-collar cul-de-sacs, and the infrastructure demands, bilingual staff, translated family communications, culturally responsive programming, now reach places that had never budgeted for them.
IPS lost 488 Hispanic students in 2025-26. Goshen lost 148. Elkhart lost 139. These are the districts with the deepest community roots, the established churches and soccer leagues and quinceañera supply shops. If the families who built those institutions are pulling back, the effect will show up not just in enrollment tables but on Main Street.
Detailed code that reproduces the analysis and figures in this article is available exclusively to EdTribune subscribers.
Discussion
Sign in to join the discussion.
Loading comments...