For eight years, the gap barely moved.
From 2014 through 2022, the white-Black graduation rate gap in Indiana hovered between 9.7 and 12.1 percentage points. It would narrow a fraction, then widen again. The Black graduation rate was stuck in the upper 70s (79.5% in 2014, 77.6% in 2022) while the white rate drifted between 89% and 92%. The gap looked permanent.
Then it wasn't.
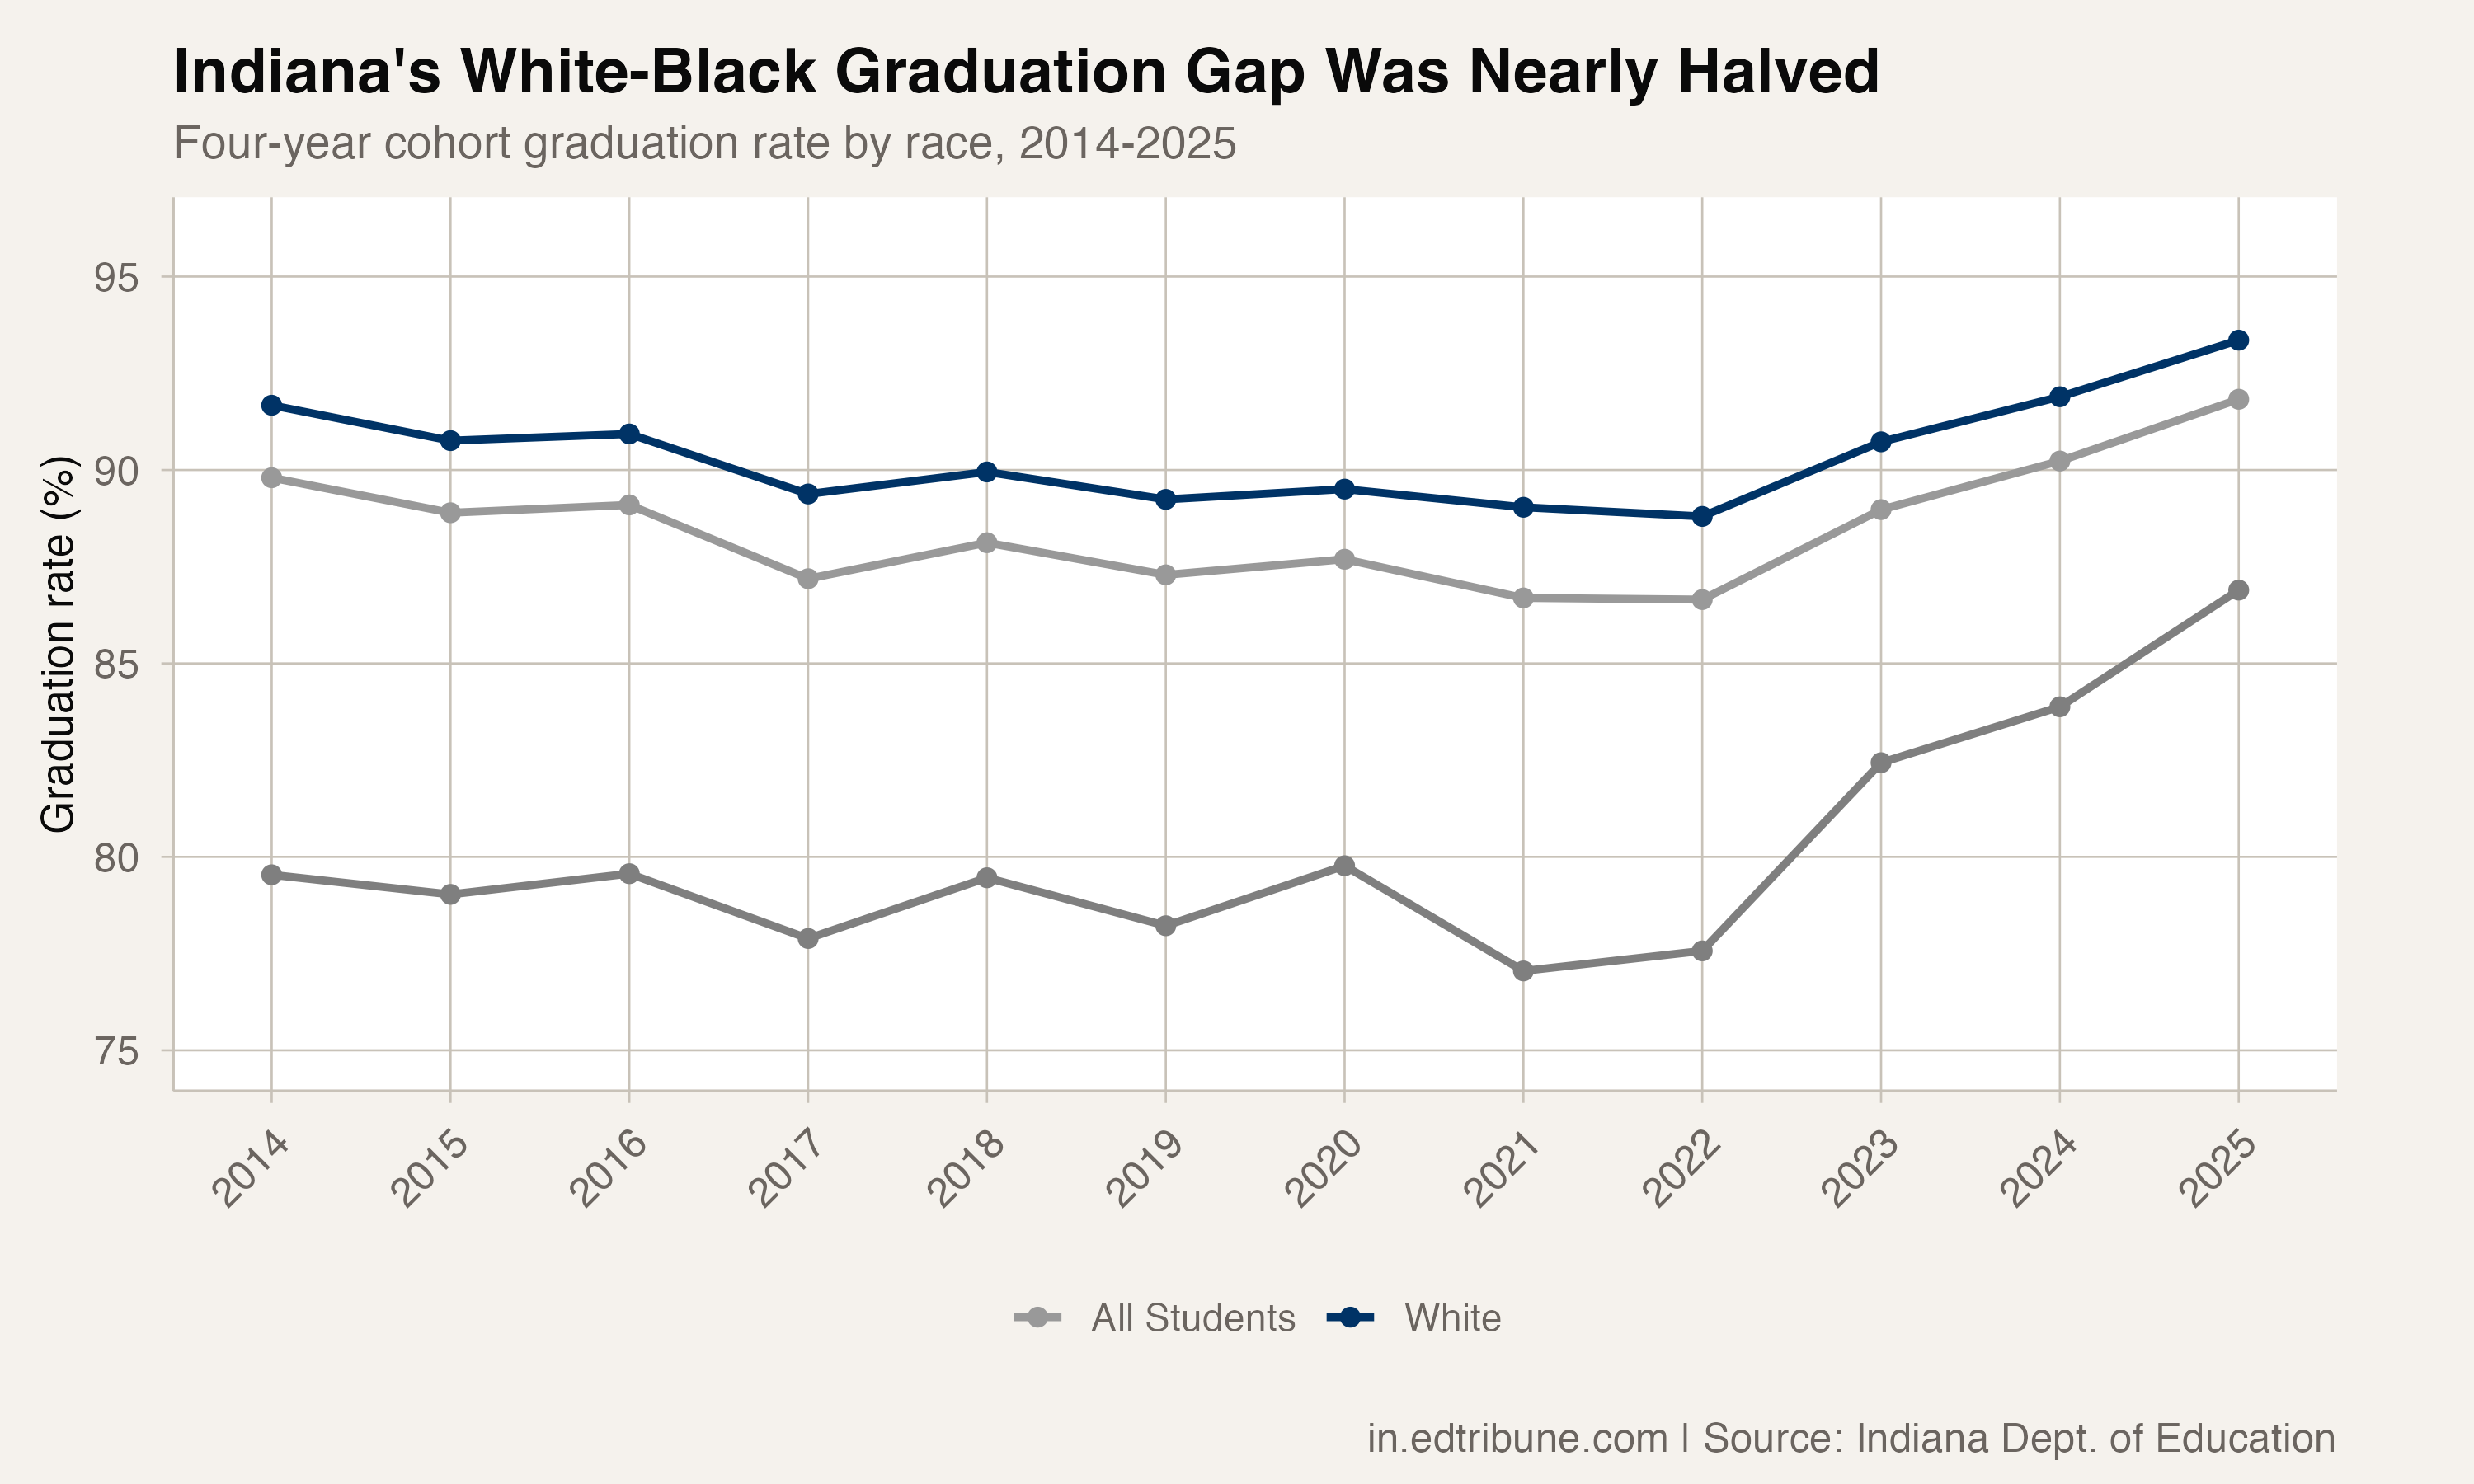
In three years, Black students gained 9.3 percentage points, from 77.6% in 2022 to 86.9% in 2025. White students gained 4.6 points over the same period. The gap collapsed from 11.2 to 6.5 percentage points, nearly halving in a span that would be considered rapid for any equity metric but is especially unusual for graduation rates, which tend to move slowly.
A decade of stagnation, then a breakout
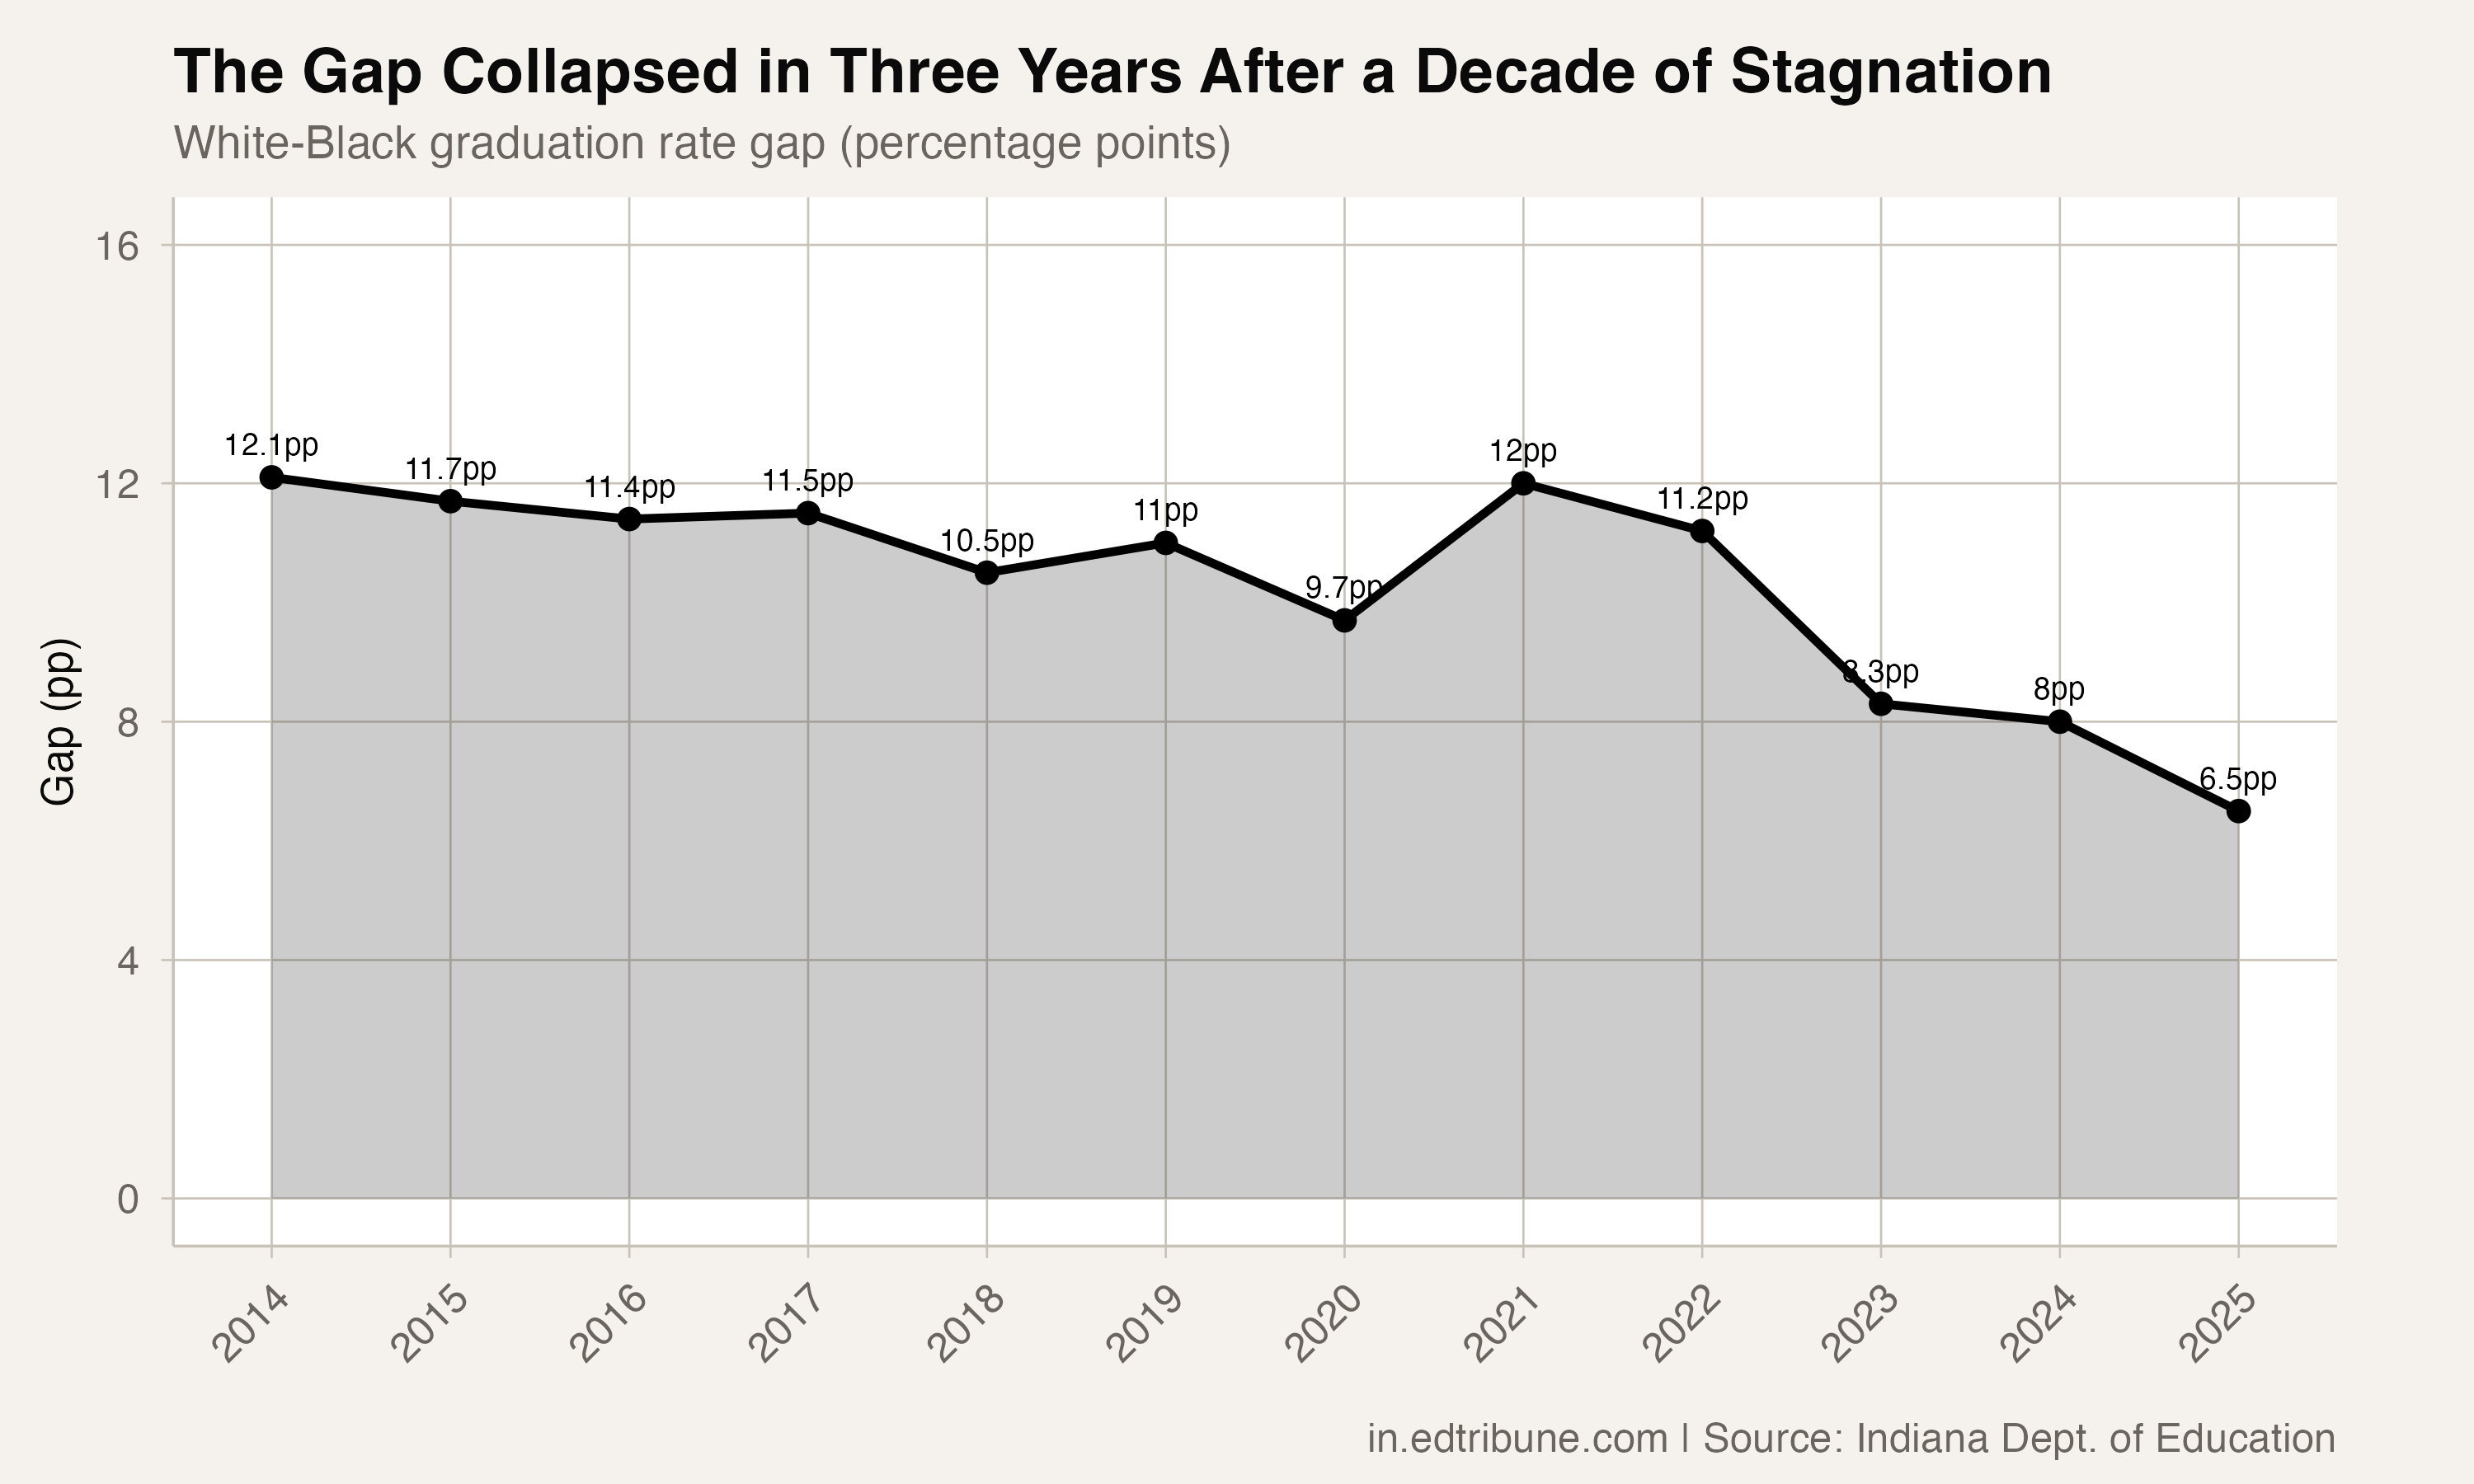
The eight-year stagnation is as notable as the three-year collapse. Through administrations, policy changes, and a pandemic, the white-Black graduation gap stayed locked at roughly 11 percentage points. Black students did not lose ground (the rate fluctuated between 77% and 80%), but they did not gain any either, while the state's overall trajectory was essentially flat.
The 2022 trough corresponds to the cohort most disrupted by COVID-19 school closures. Black students, disproportionately in urban districts with longer periods of remote instruction, were hit harder. The white rate also dipped, to 88.8%, but the Black rate fell more.
What followed was not just recovery but acceleration. The gap went from 11.2 in 2022 to 8.3 in 2023, then 8.0 in 2024, then 6.5 in 2025.
Black students gained the most in the post-COVID surge
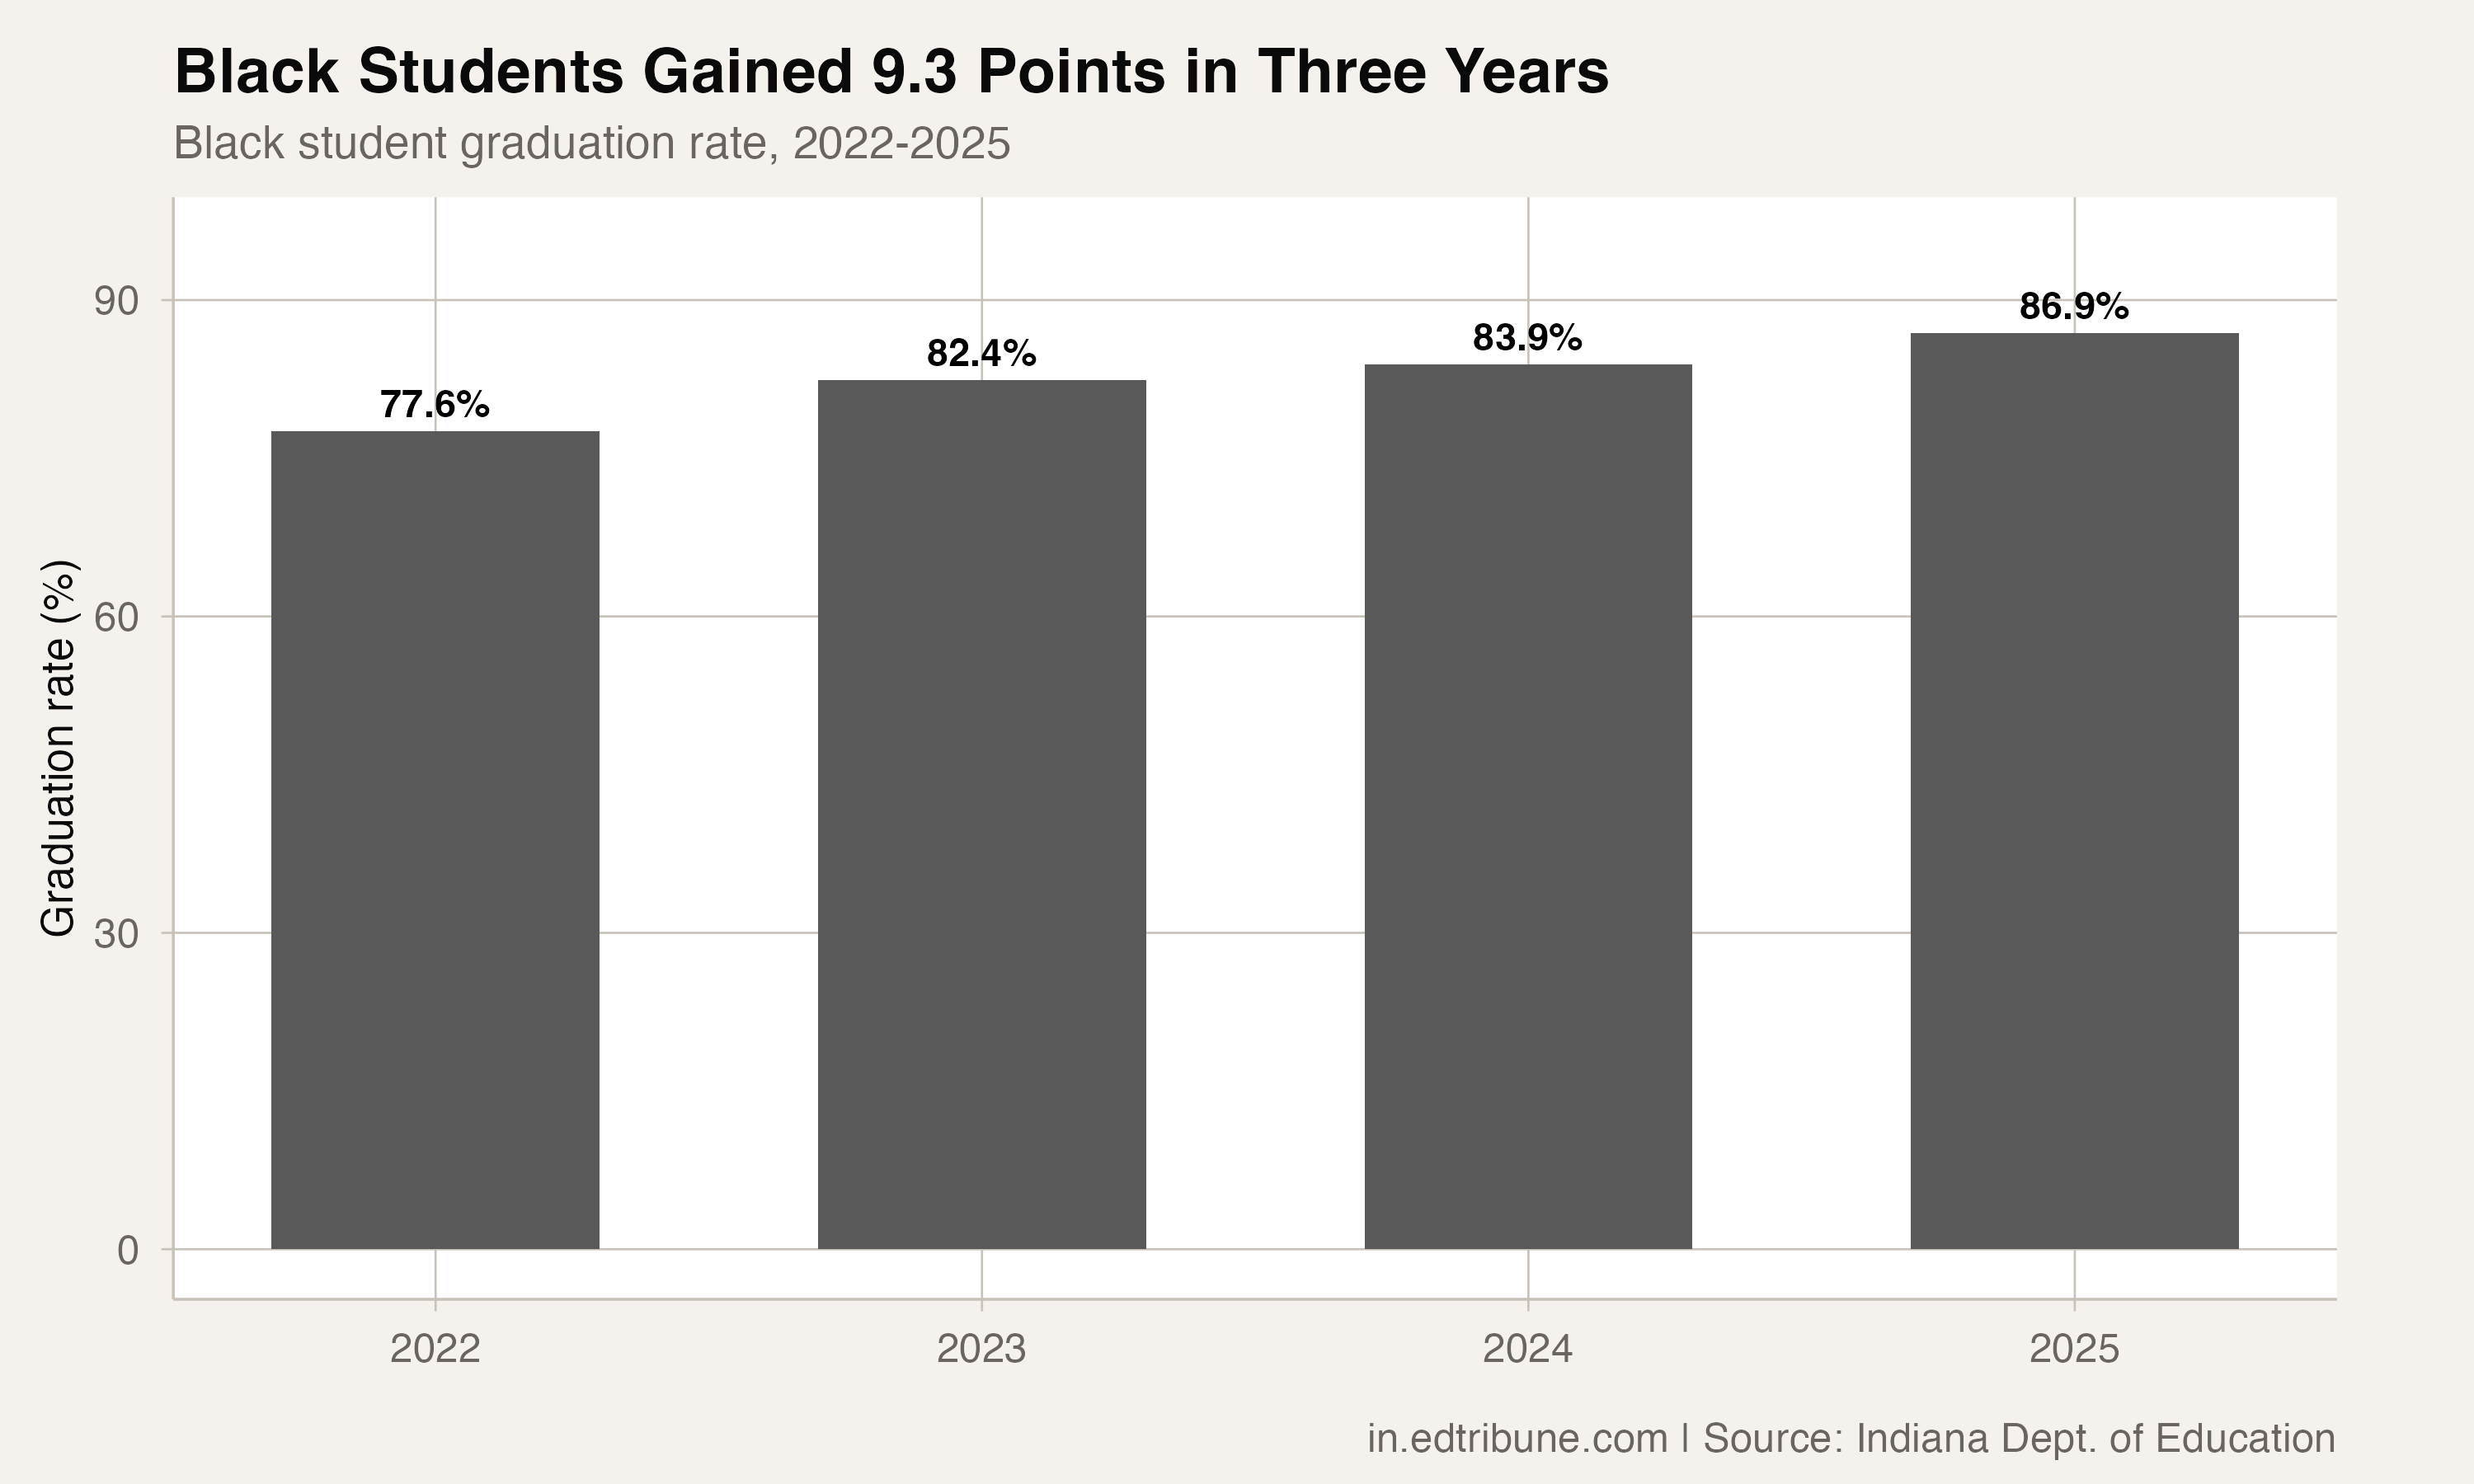
The 9.3 percentage point gain for Black students from 2022 to 2025 is the largest three-year improvement for any major racial subgroup in Indiana's graduation data. For context, the entire statewide graduation rate gained 5.2 points over the same period.
Black students went from the subgroup with the second-lowest rate (after Native American students, though at state level Native American data is volatile due to small samples) to 86.9%, still the lowest of the major racial groups but closing the distance to Hispanic students at 89.8%.
The improvement was not evenly distributed across Indiana. Districts like Indianapolis Public Schools posted a 93.8% Black graduation rate in 2025, well above the state average. But the state-level trend reflects gains across multiple districts, not just IPS.
Where the gap sits now
At 6.5 percentage points, the white-Black gap is still the second-widest racial gap in Indiana's graduation data. Only the white-Native American gap (6.7 points) is larger. But the trajectory matters. The white-Native American gap has been essentially unchanged over the decade, while the white-Black gap has been cut nearly in half in three years.
If the current rate of closure continued, and there is no guarantee it will, the gap would reach near-zero within three to four years. However, gap closure typically slows as rates approach natural ceilings. With white students already at 93.4%, further gains for that group are constrained, which means additional closure depends on Black students continuing their current trajectory.
What the state data cannot tell us is how much of the closing reflects classroom gains versus shifts in completion pathways. Indiana's reported graduation rate counts waiver diplomas alongside fully earned ones, and the published figures do not break those apart by race. That caveat does not erase the progress. A near-doubling of the closure rate over a metric this slow-moving is real movement. But the durability of the gain is the open question, and it will take another two or three cohorts to know whether the trajectory holds.
Detailed code that reproduces the analysis and figures in this article is available exclusively to EdTribune subscribers.
Discussion
Sign in to join the discussion.
Loading comments...