In 2017, Gary Community School Corp↗ET graduated 89.6% of its senior cohort, actually above the state average. It was a quiet bright spot in a district already under financial distress, a number that suggested the academic side of the house was holding together even as the fiscal side crumbled.
By 2025, that rate had fallen to 57.8%.
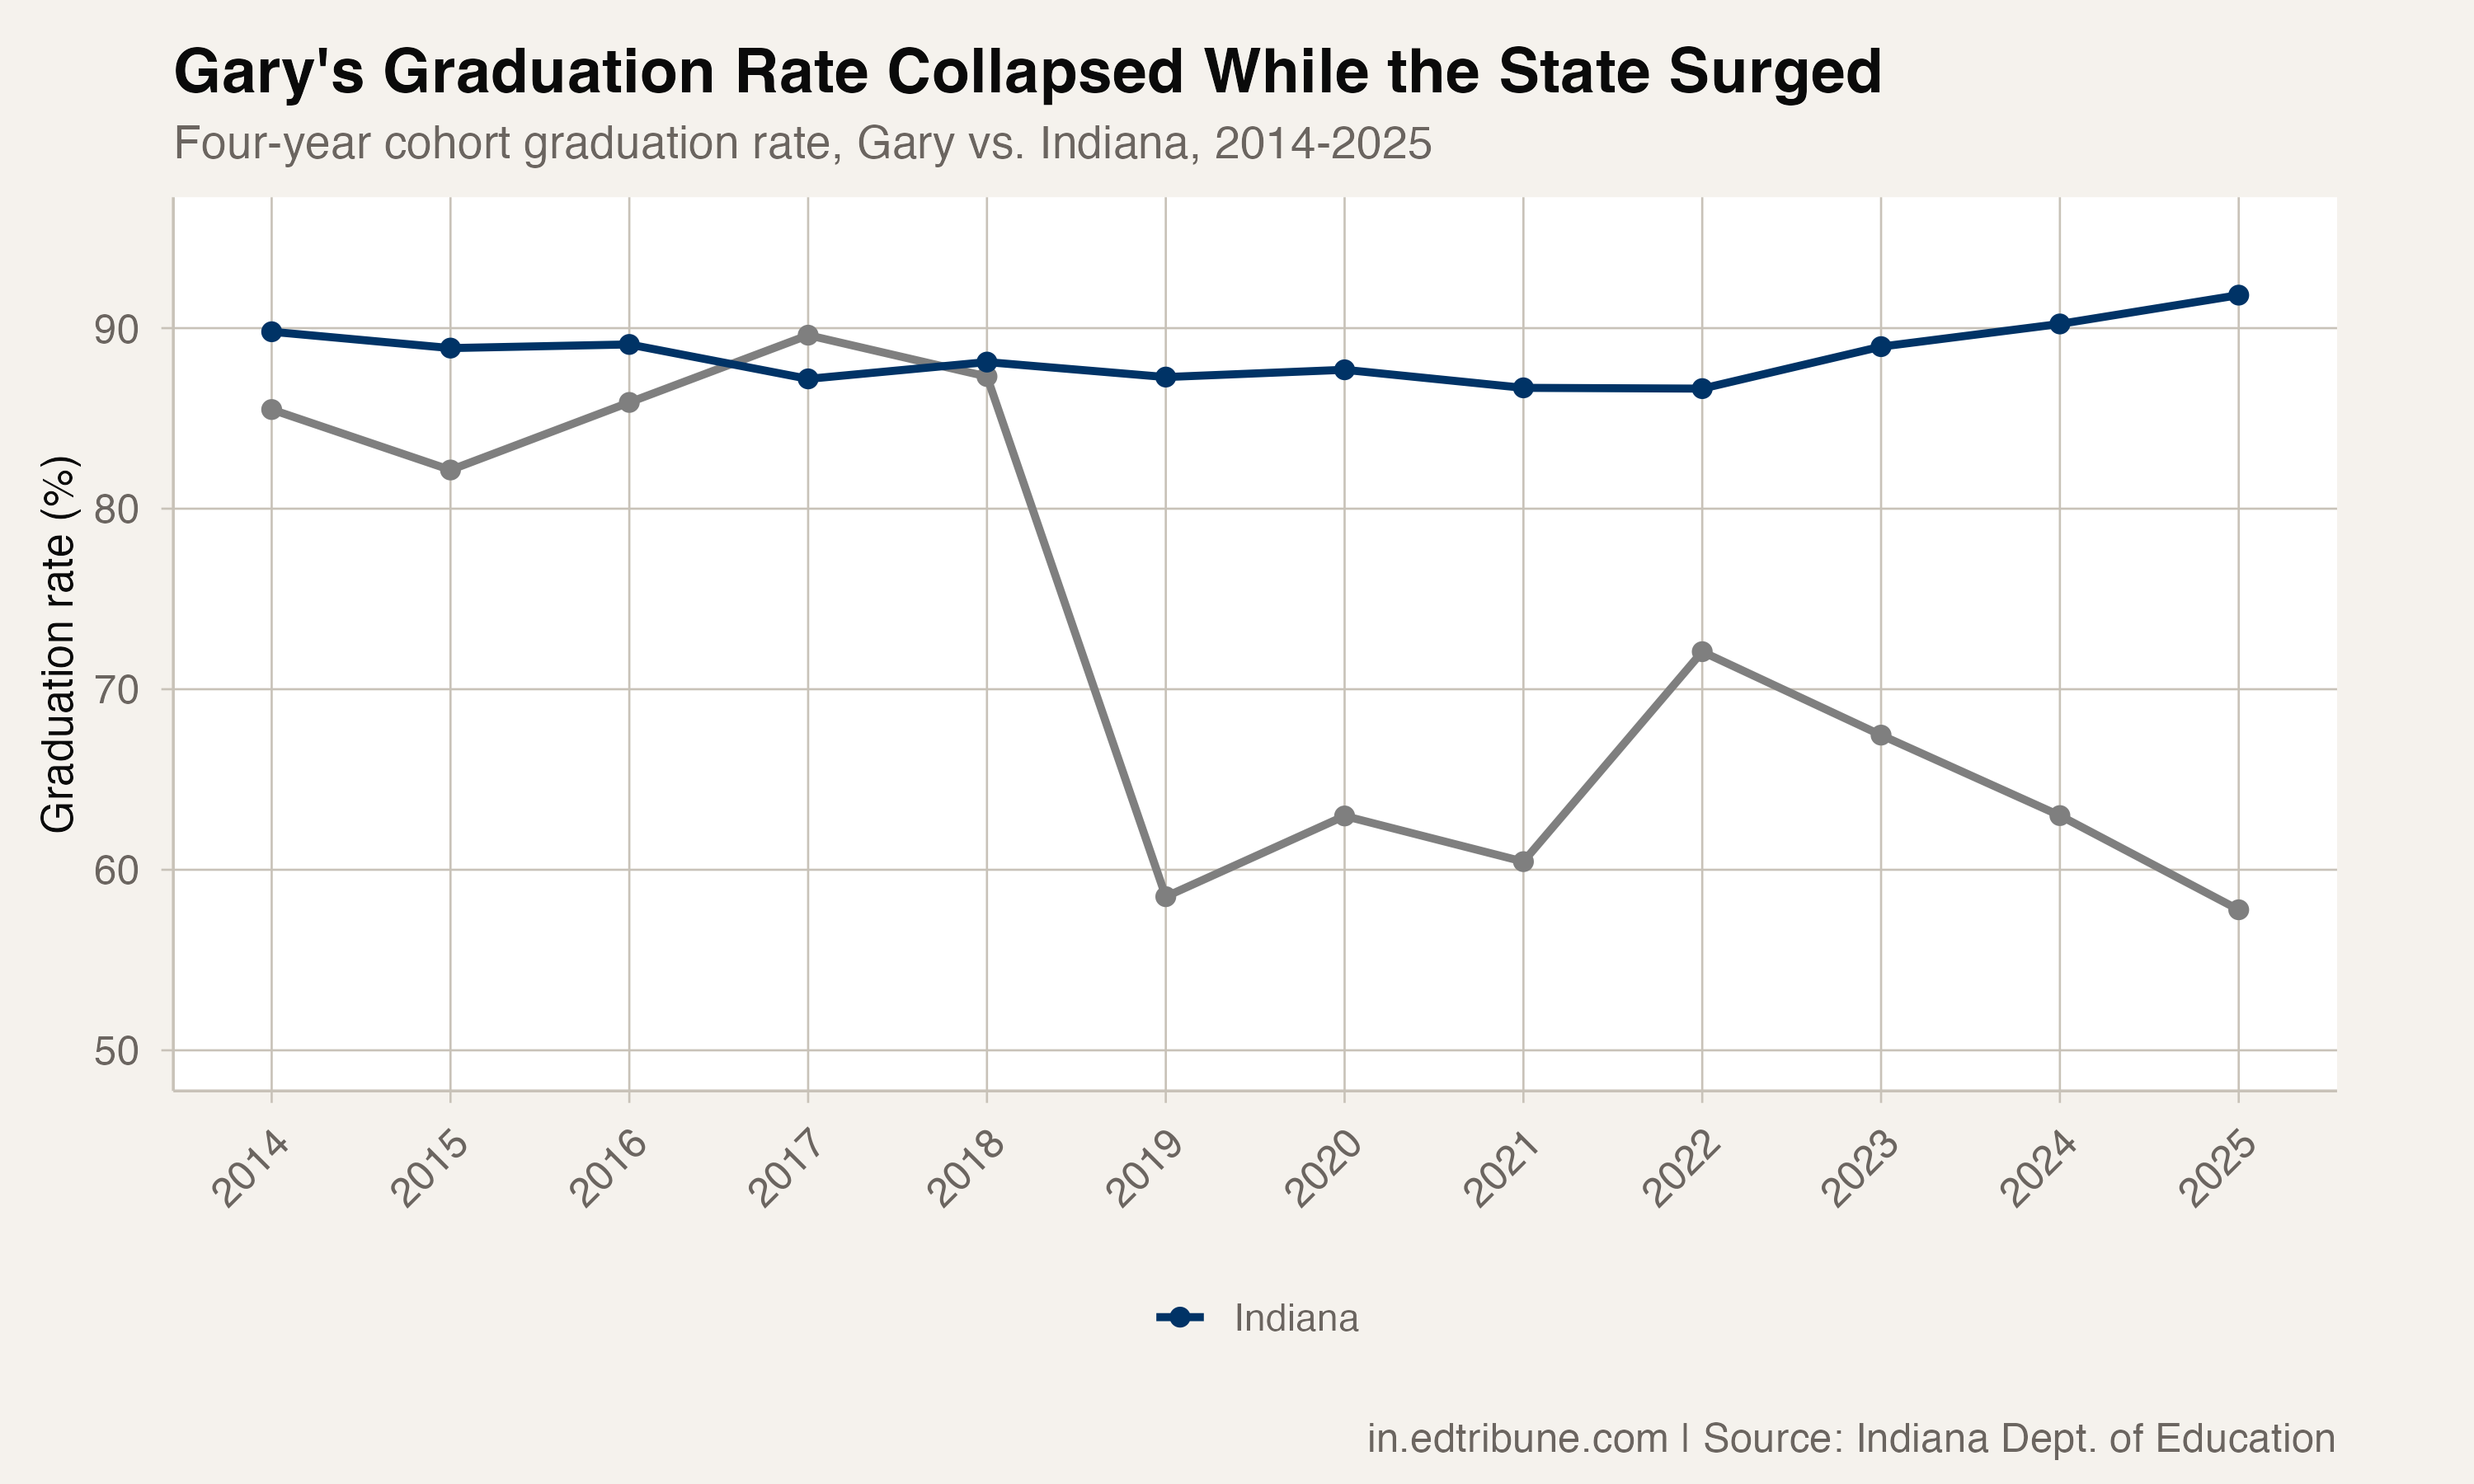
The 27.7 percentage point decline from 2014 to 2025 is the largest of any Indiana school corporation with a cohort of 100 or more students. The next-largest decliner, Logansport, lost 12.2 points, less than half as much.
The takeover and the cliff
Gary's trajectory has two distinct eras. From 2014 through 2018, the rate fluctuated between 82% and 90%, respectable and competitive with state averages. Then between the 2018 and 2019 graduation cohorts, the rate fell off a cliff: from 87.3% to 58.5%.
That 28.8 percentage point single-year drop is the largest one-year decline for any Indiana corporation with a cohort of 100 or more students in both years. It coincided with the state's takeover of the district. Indiana placed Gary under emergency management in 2017, assuming control of finances and operations. The graduation rate did not immediately respond. The 2017 and 2018 cohorts had largely been educated under the prior administration. But the 2019 cohort, the first to spend its full high school career under state control, posted a rate nearly 30 points lower.
The rate never recovered. It bounced to 72.1% in 2022, then fell back to 67.5%, then 63%, and finally 57.8% in 2025. That is the lowest in the available data.
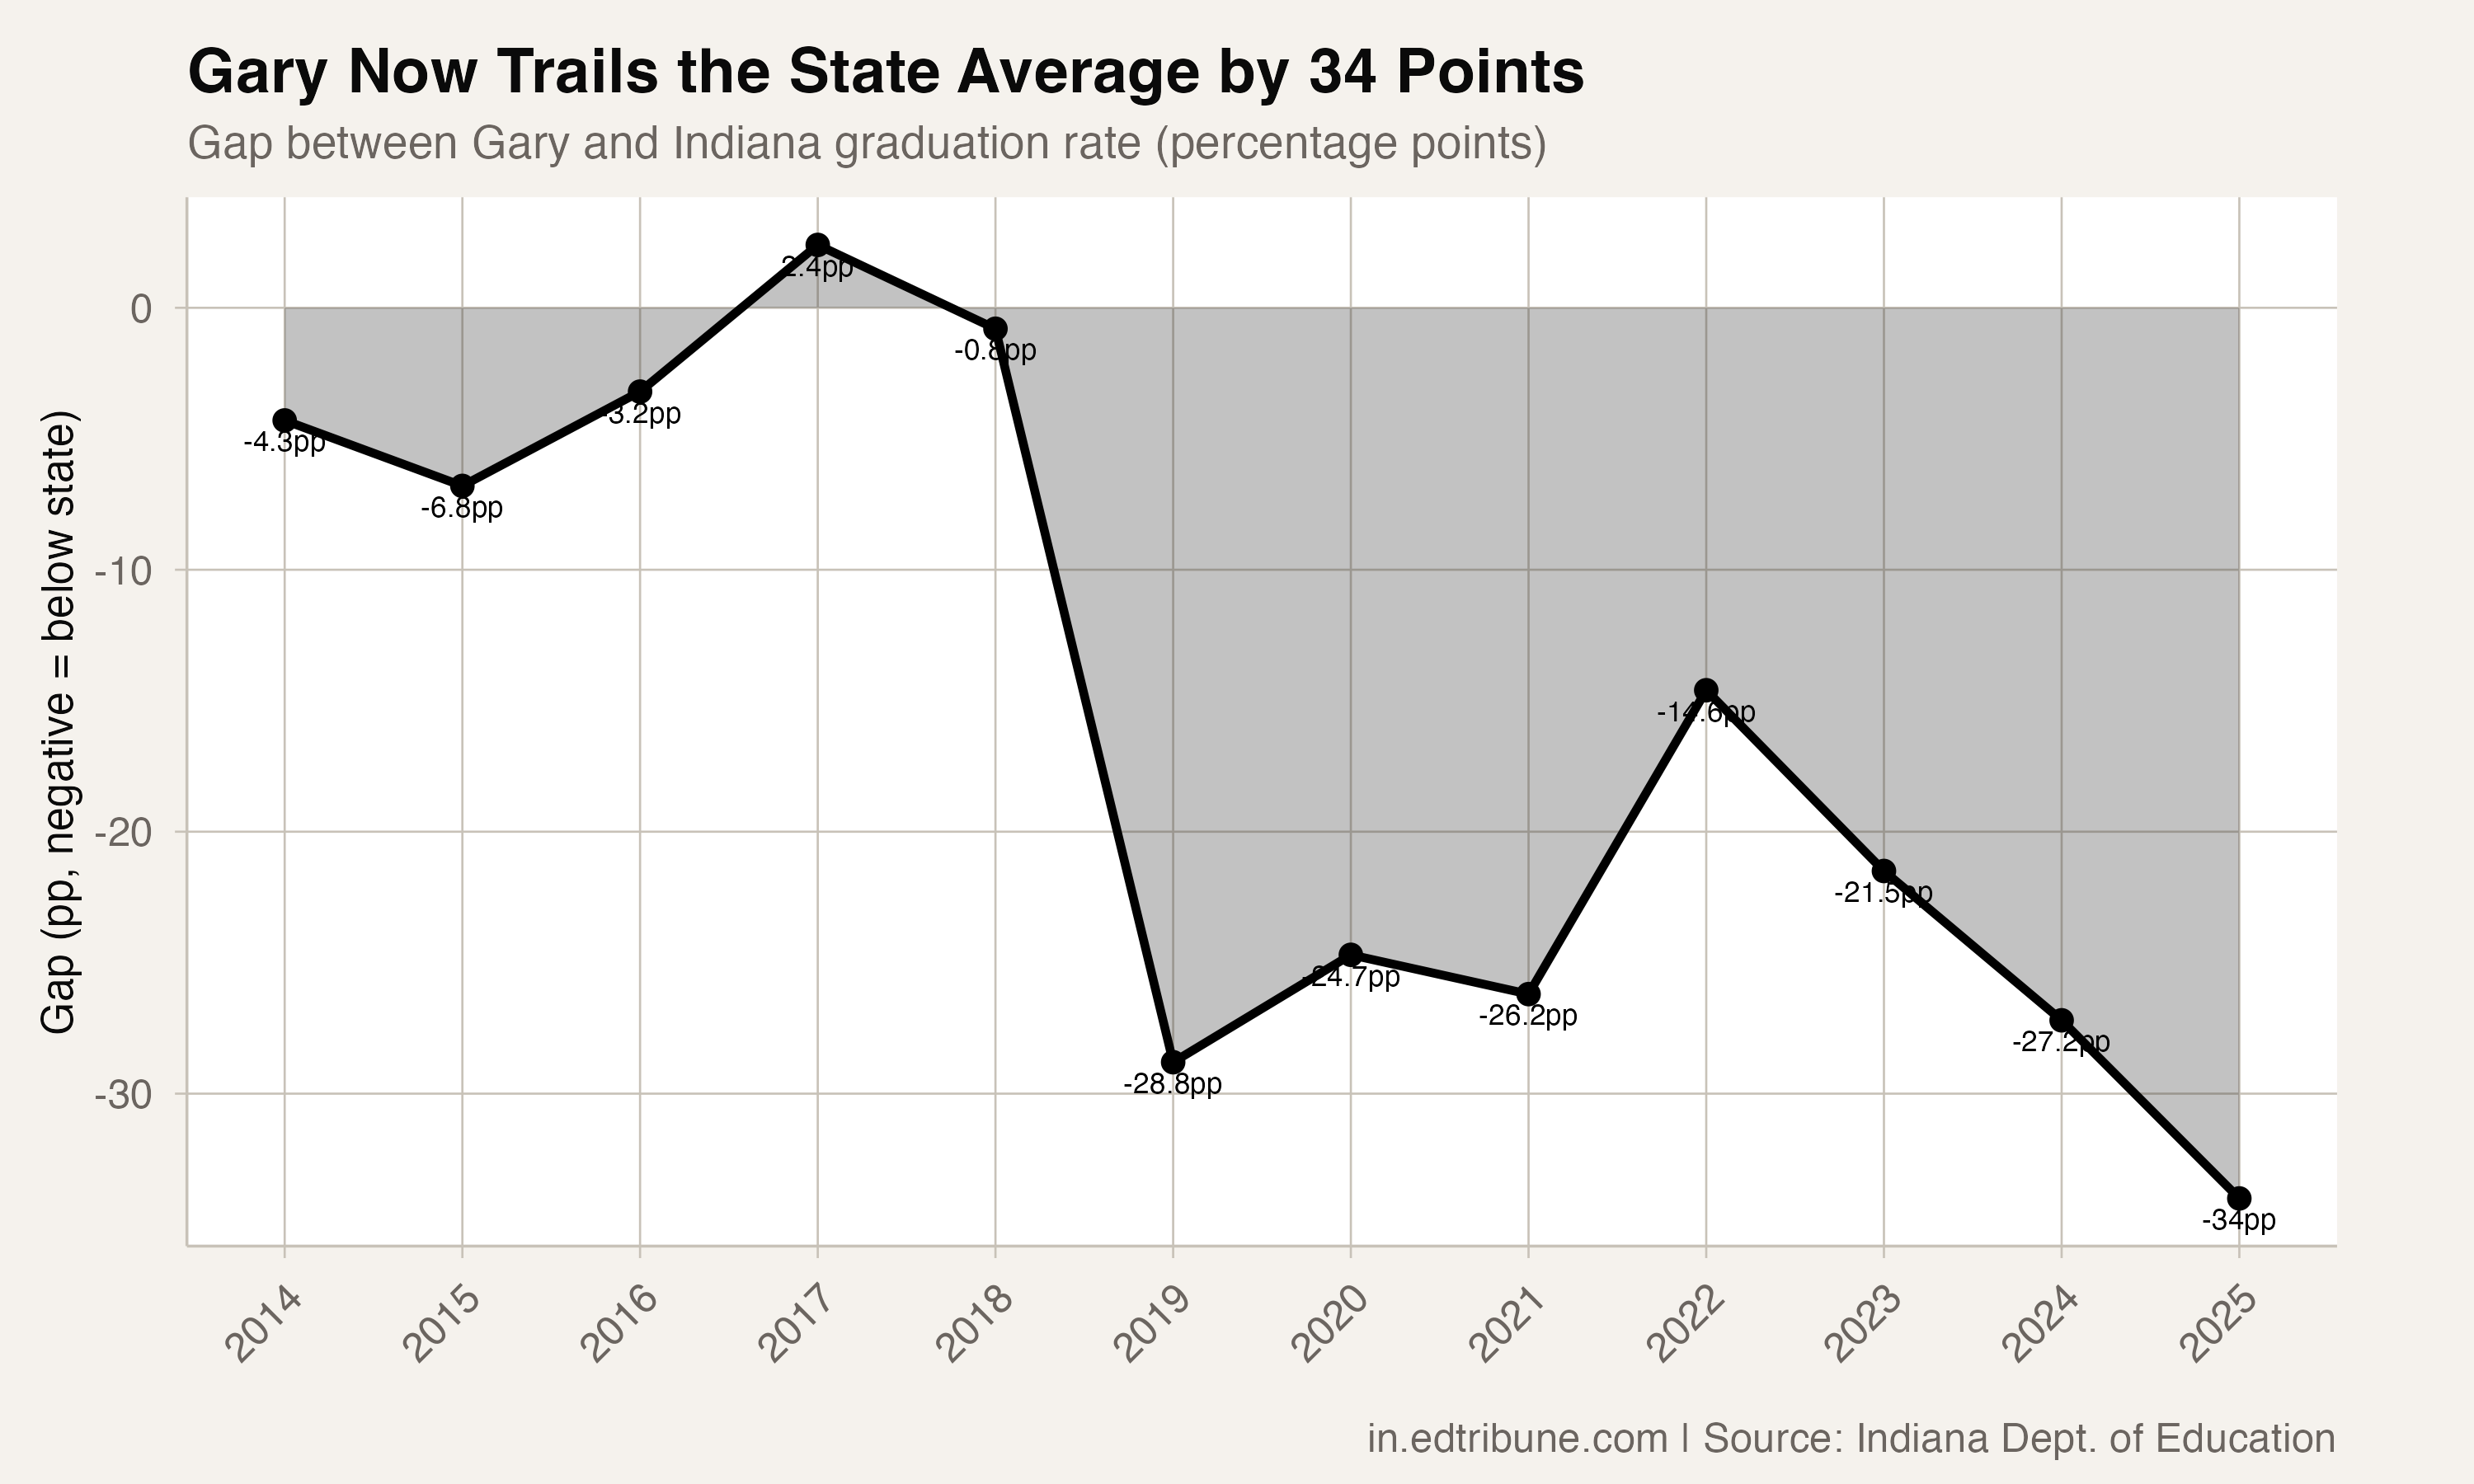
The gap between Gary and the state average widened from 4.3 points in 2014 to 34.0 points in 2025. While Indiana reached an all-time high of 91.8%, Gary sank to an all-time low.
The cohort stayed. The rate didn't.
One explanation that the data rules out: this is not a story of a shrinking cohort distorting the numbers. Gary's graduation cohort was 386 in 2014 and 334 in 2025. It dipped to 205 in 2018, roughly the period when school closures and consolidation reduced the number of students, but rebounded to the 280-360 range in subsequent years.
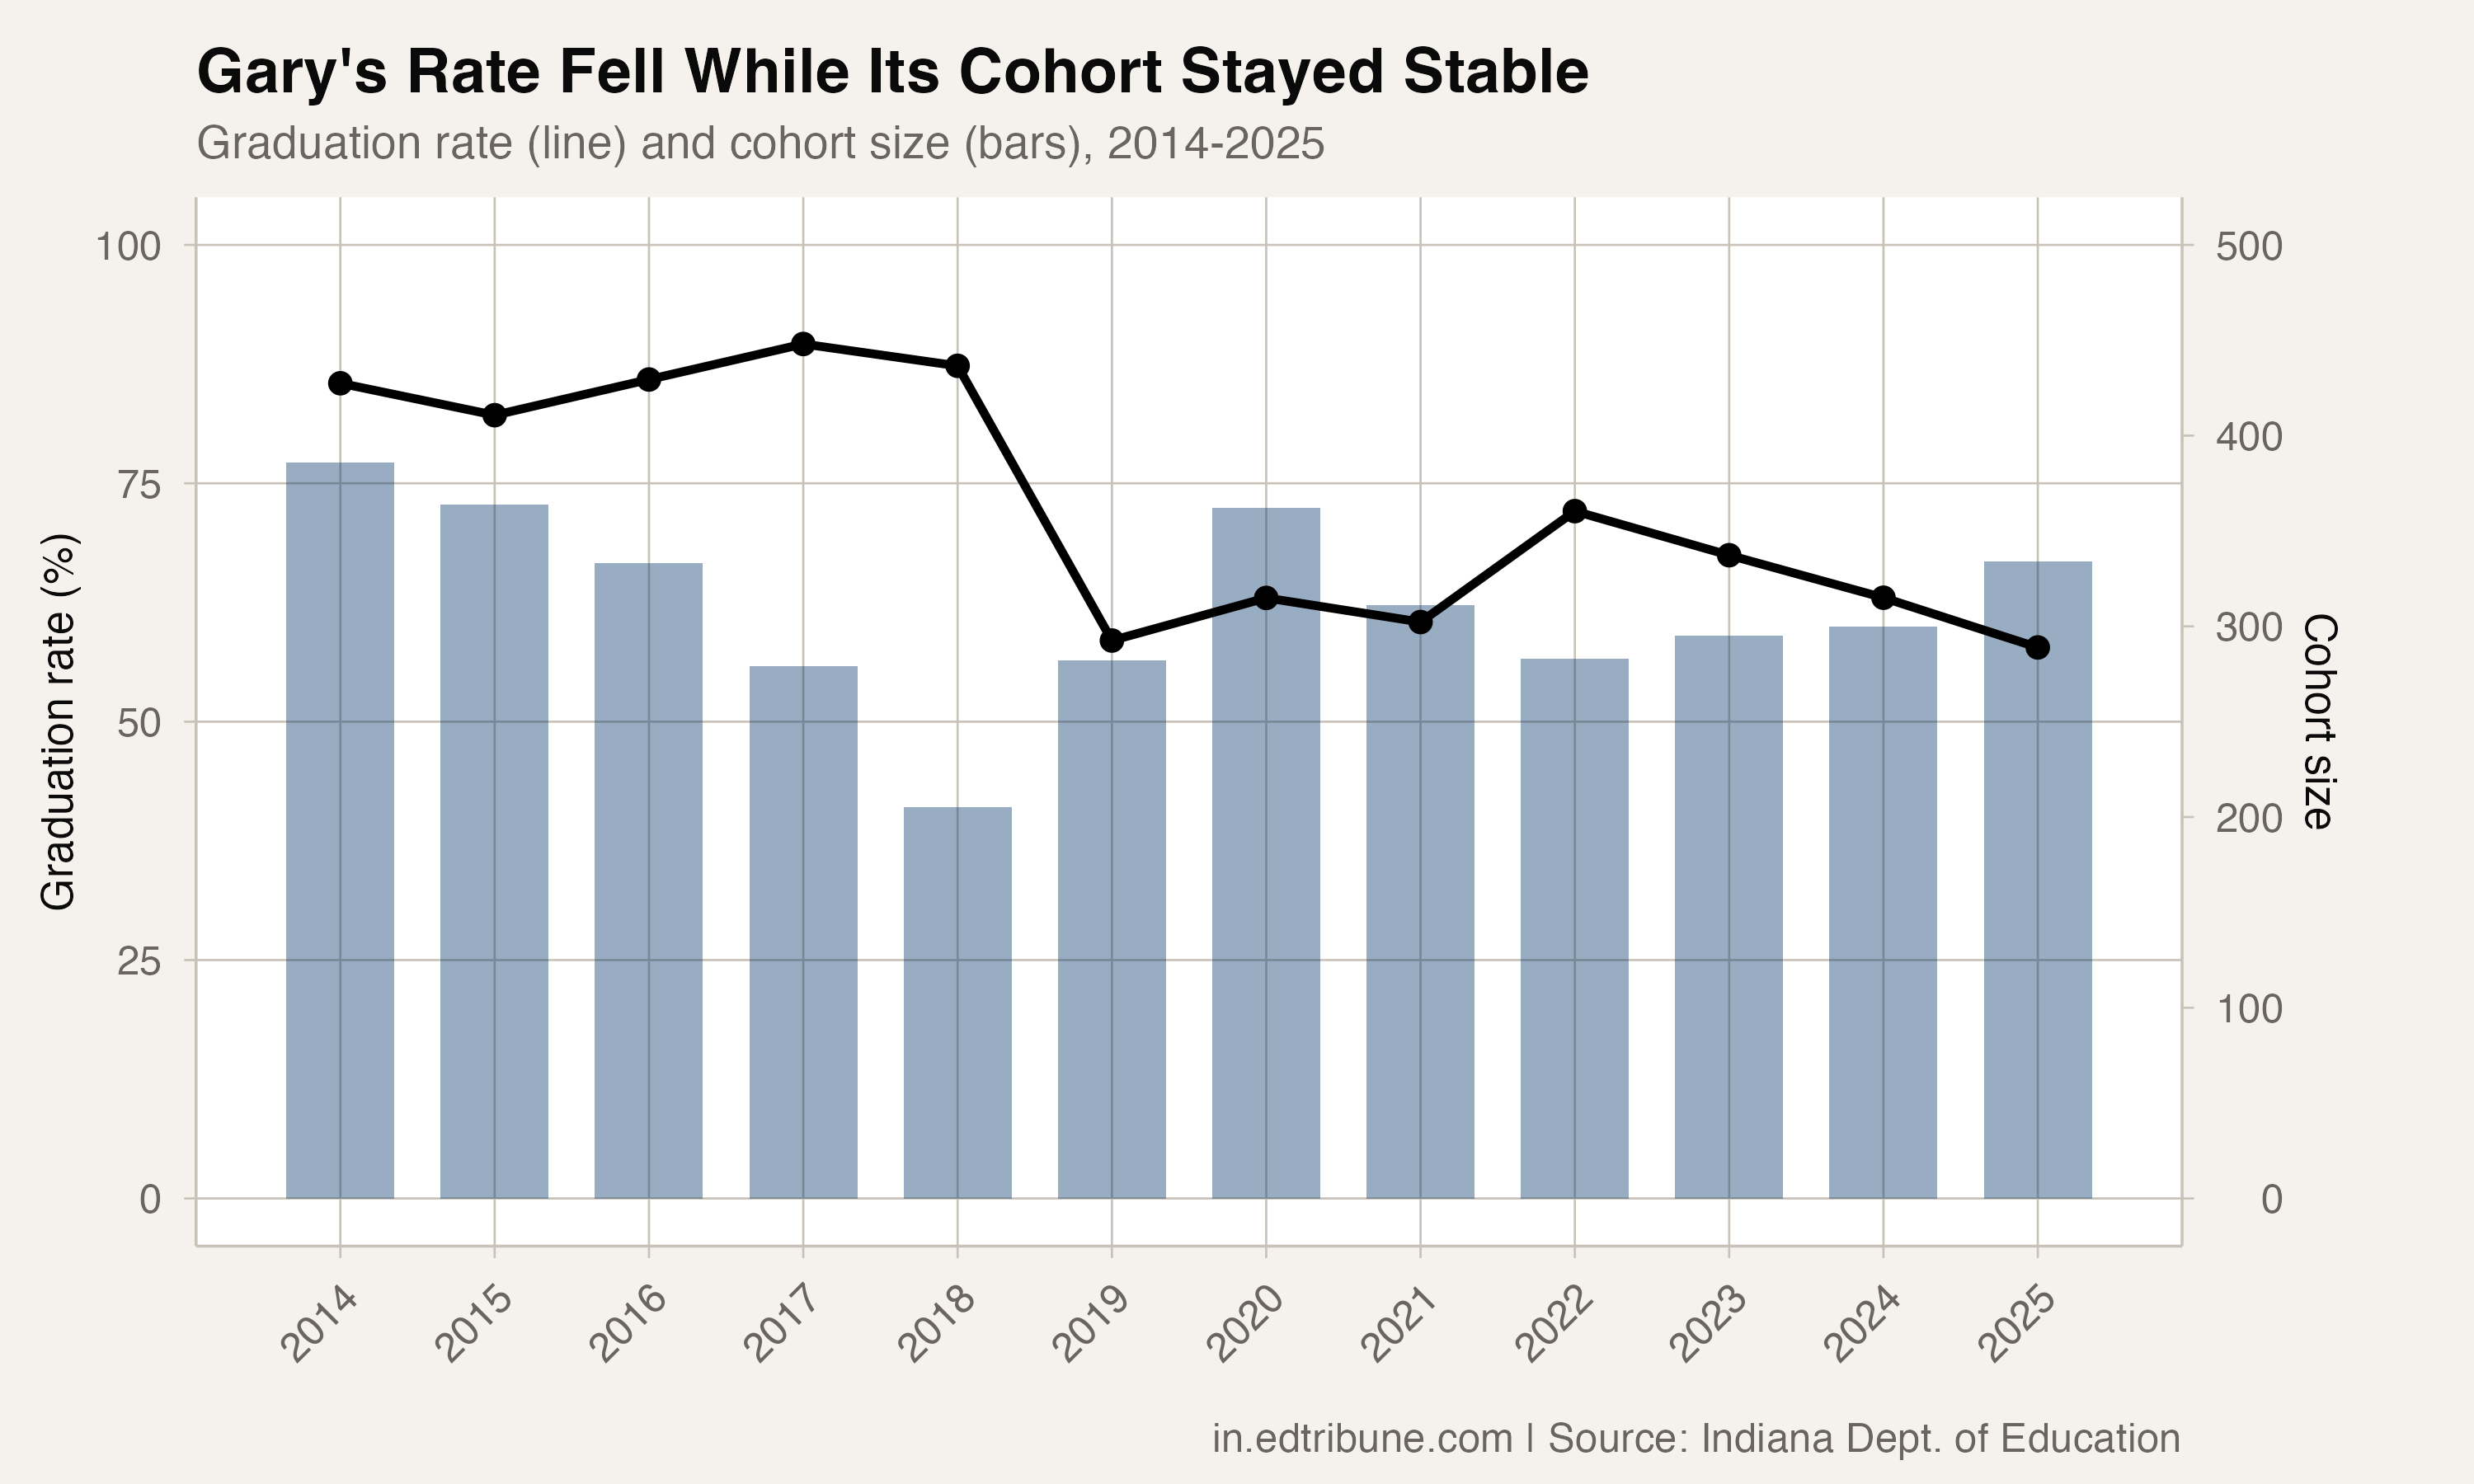
The 2025 cohort of 334 students is large enough that the 57.8% rate is not a small-sample artifact. Approximately 141 students in the cohort did not graduate on time.
Beneath the headline
Every student subgroup at Gary with reportable data posted rates far below state averages in 2025. Black students, 90% of the cohort, graduated at 58.3%, compared to 86.9% statewide. Male students graduated at 52.7%, meaning nearly half did not finish on time. Special education students posted 41.3%.
The economically disadvantaged subgroup graduated at 74.1%, substantially higher than the overall rate, a pattern suggesting that the broader "economically disadvantaged" definition captures a wider slice of the student body, including students who are relatively better-positioned academically. The paid-meals subgroup, a narrower measure of poverty, graduated at just 45.4%.
The state's role
Gary is not the only Indiana district under state intervention, but it is the one where the graduation rate has fallen the furthest and fastest after the takeover. The state assumed emergency management with the stated goal of stabilizing the district's finances and improving academic outcomes. By the graduation rate measure, academic outcomes have moved sharply in the wrong direction.
Gary faces population loss, industrial decline, and resource constraints that precede state intervention. Maybe the decline would have happened regardless. But eight years after the state took control, the graduation rate is 32 points lower than it was the year the takeover began.
Detailed code that reproduces the analysis and figures in this article is available exclusively to EdTribune subscribers.
Discussion
Sign in to join the discussion.
Loading comments...