In 2019, students who were economically disadvantaged in Indiana graduated at 82.3% — 11.5 percentage points below their paid-meals peers. The gap was wide and persistent, the kind of disparity that education researchers describe as structural.
By 2025, the gap was 0.8 percentage points.
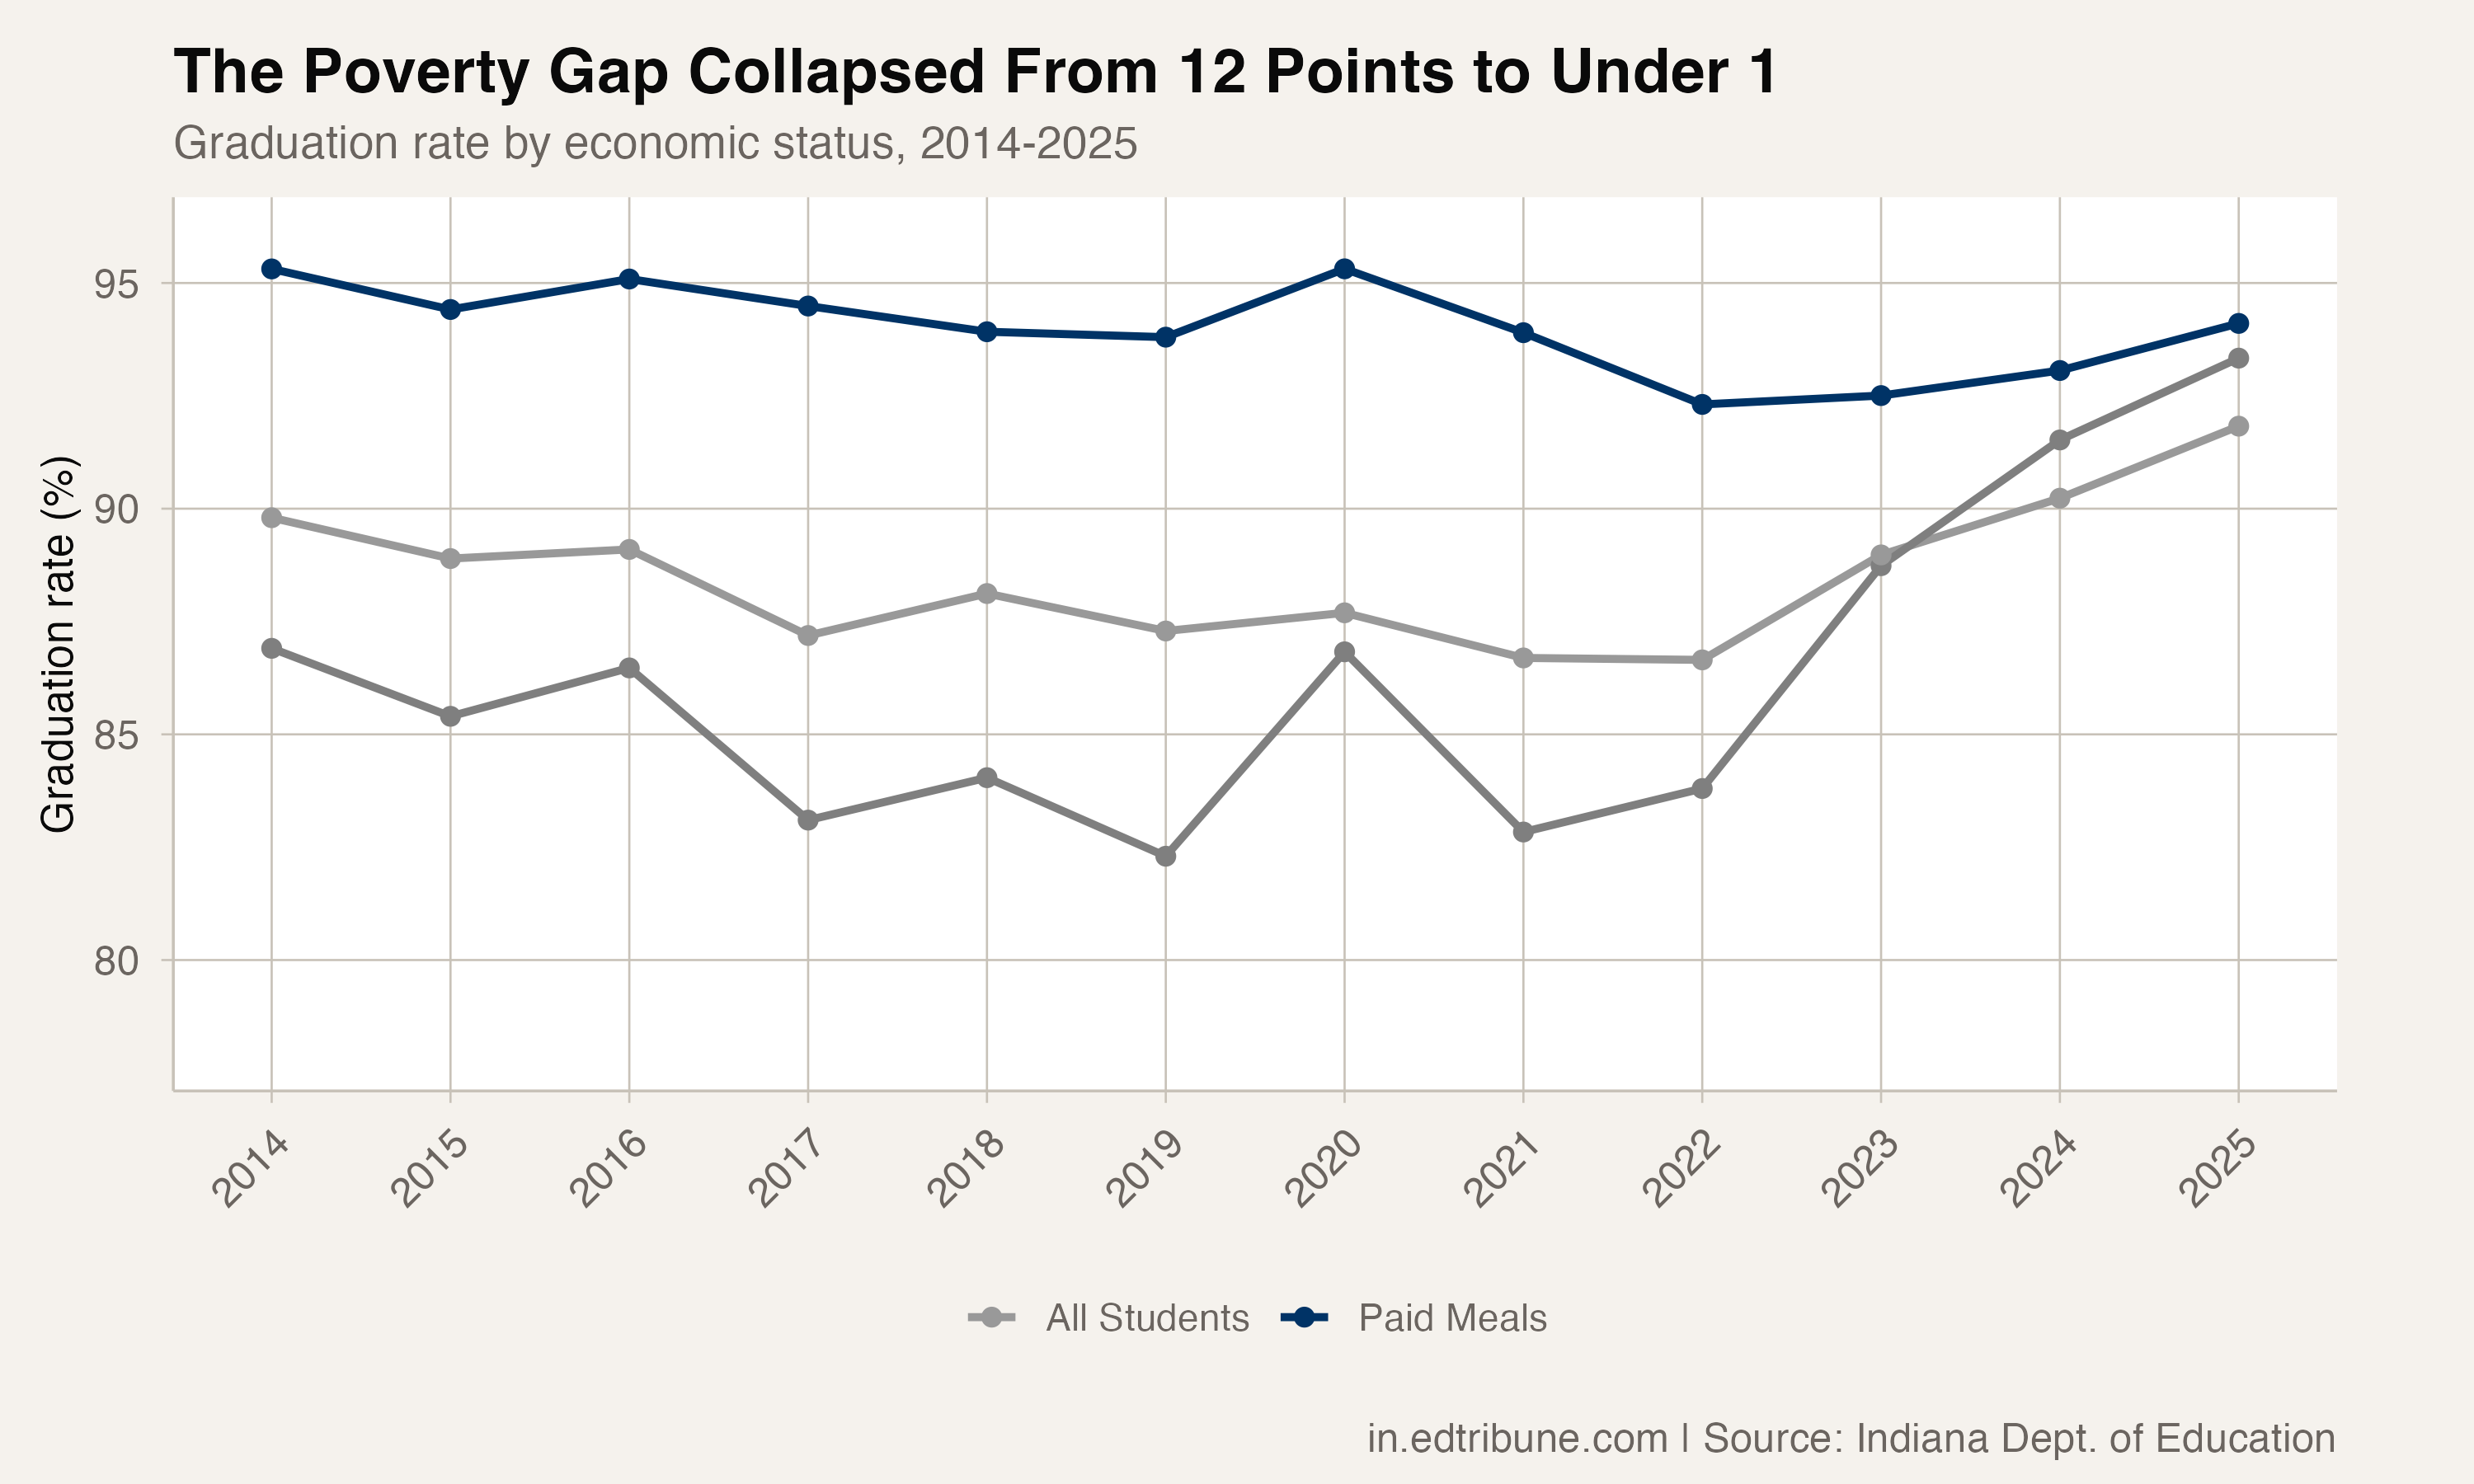
Students who are economically disadvantaged now graduate at 93.3% — above the overall state average of 91.8%, and closing in on the paid-meals rate of 94.1%. The near-closure of the gap is one of the most striking findings in Indiana's 2025 graduation data.
It is also one that demands the most scrutiny.
What the numbers show
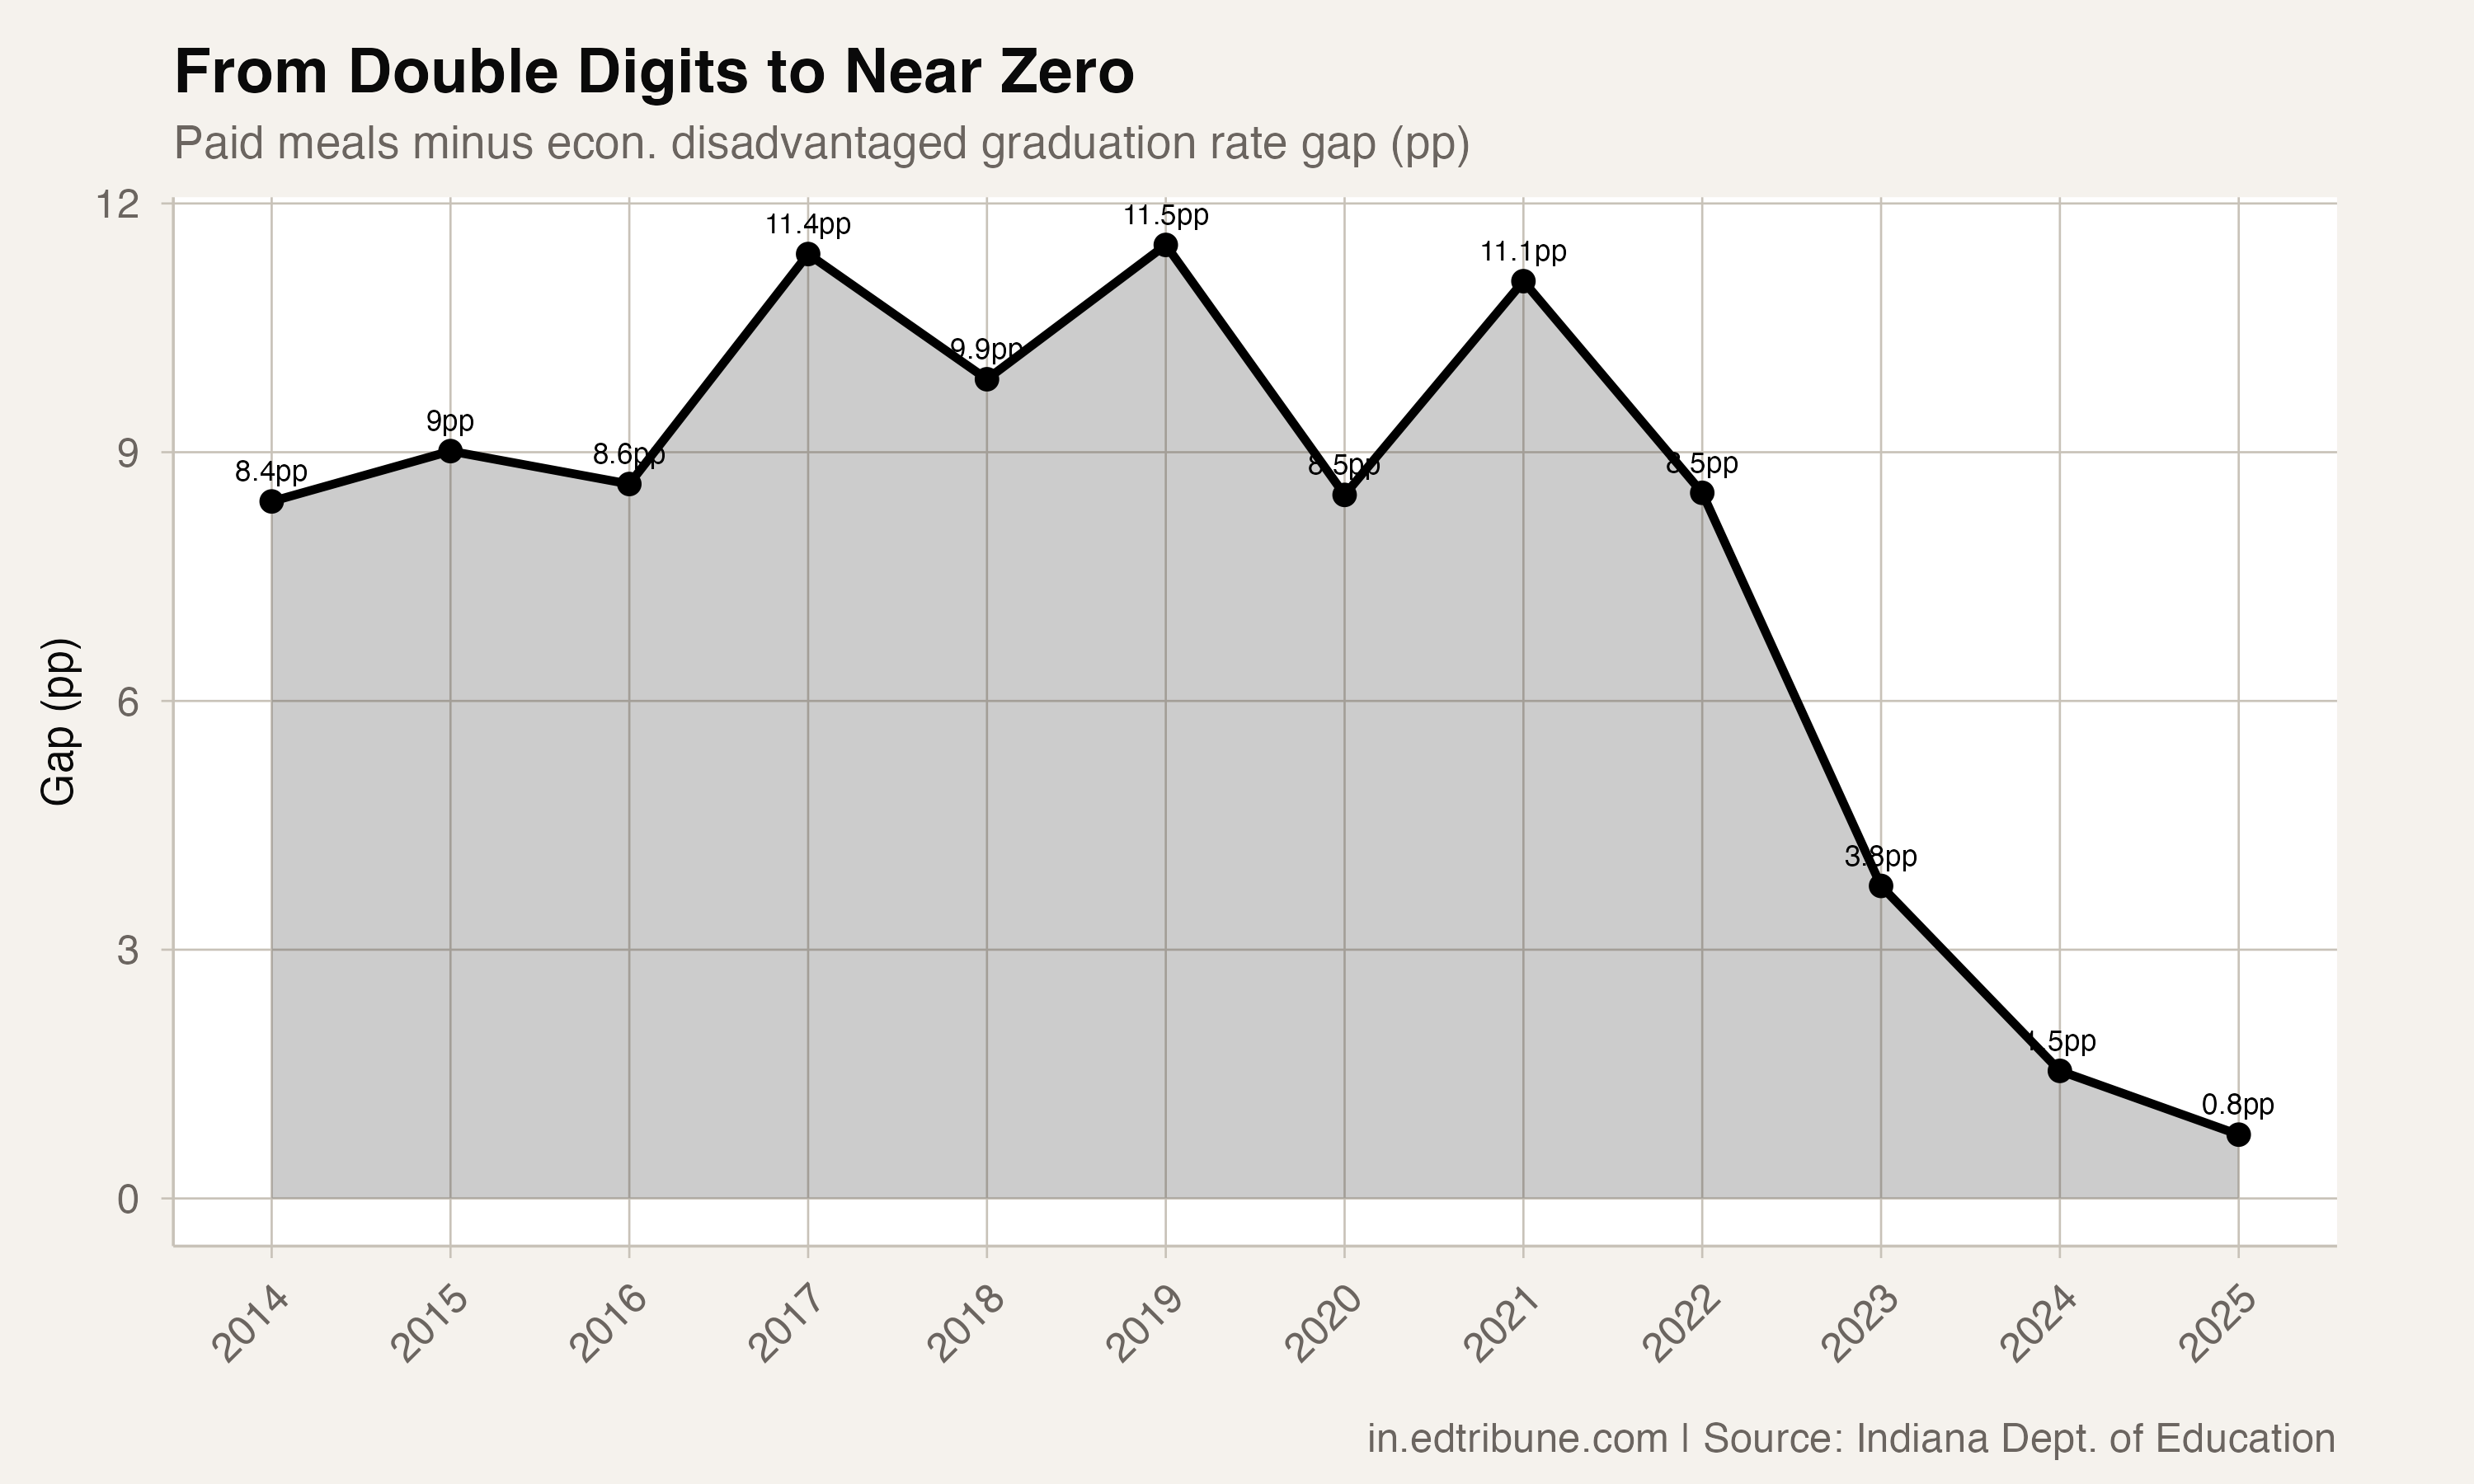
From 2014 through 2022, the gap between paid-meals and economically disadvantaged students sat in the high single digits or low double digits, ranging from 8.4 to 11.5 percentage points. Then it began narrowing sharply: 8.5 points in 2022, 3.8 in 2023, 1.5 in 2024, 0.8 in 2025.
Both groups improved. The paid-meals rate moved from 93.8% to 94.1% over the period. The rate for students who are economically disadvantaged moved from 82.3% to 93.3% — an 11 percentage point gain that ranks among the largest improvements of any subgroup, behind only students with disabilities (+16.6 points), students learning English (+14.6 points), and Pacific Islander students (+12.9 points).
The definition question
Indiana, like many states, has broadened its definition of "economically disadvantaged" over the past several years. The Community Eligibility Provision allows entire schools or districts to classify all students as economically disadvantaged for meal program purposes, regardless of individual family income. States have also expanded eligibility criteria beyond traditional free and reduced lunch qualification.
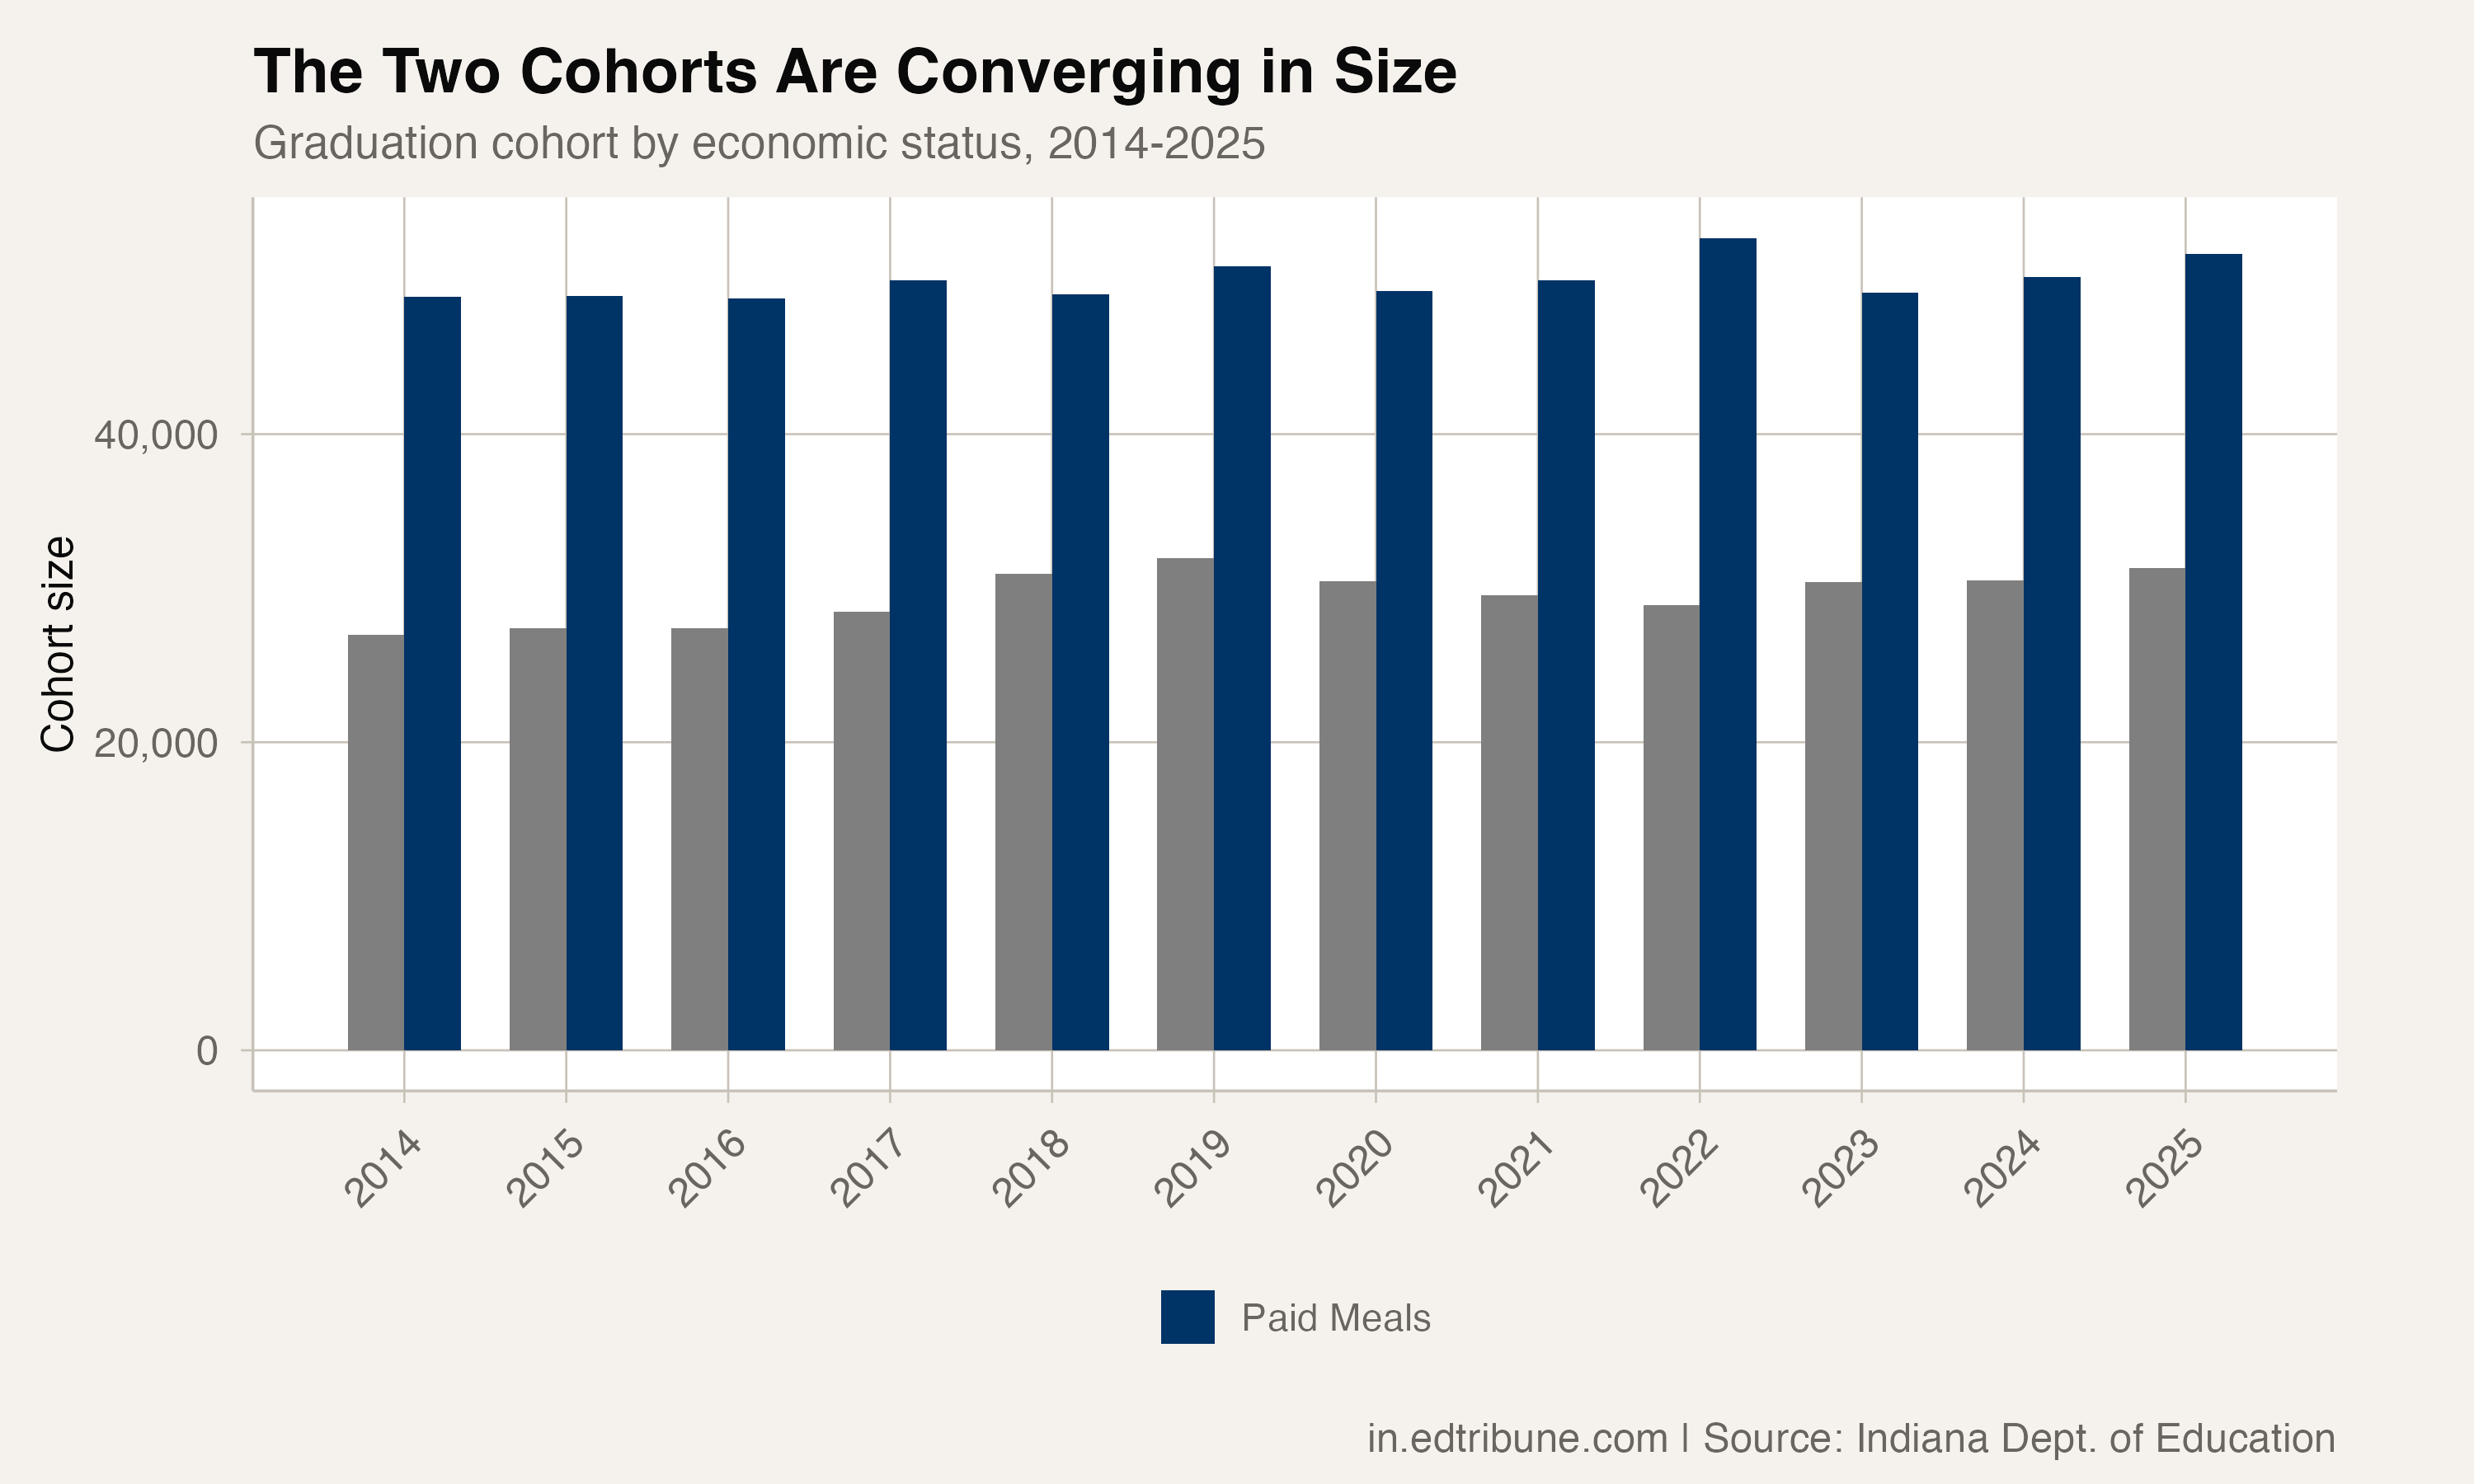
The cohort data shows the shift. The economically disadvantaged cohort grew about 16% from 2014 to 2025 (26,966 to 31,315 students), while the paid-meals cohort grew roughly 6% (48,933 to 51,721). When the definition broadens to include families further up the income scale — who tend to have higher graduation rates — the subgroup average can rise mechanically, even without any change in outcomes for the lowest-income students.
This does not mean the improvement is fake. Students classified as economically disadvantaged in 2025 are genuinely graduating at higher rates. But the group labeled "economically disadvantaged" in 2025 is not the same population that carried that label in 2019. The comparison is confounded by a moving definition.
What the data can support
Even with the definition caveat, two things are clear. First, the paid-meals rate — the narrower, more stable measure of economic status — improved modestly from 93.8% to 94.1%, indicating that students from higher-income families did not pull away. Second, the 93.3% rate for students who are economically disadvantaged means that by whatever definition Indiana is using, the students classified as such are graduating at rates that were historically associated only with more affluent populations.
Whether that reflects genuine academic improvement, broader CEP adoption that diluted the disadvantaged category, expanded waiver pathways, or some combination of all three is the question the data raises but cannot resolve.
Detailed code that reproduces the analysis and figures in this article is available exclusively to EdTribune subscribers.
Discussion
Sign in to join the discussion.
Loading comments...