For most of the past decade, Indianapolis Public Schools↗ET was a cautionary tale — the state capital's school district with a graduation rate that trailed Indiana's average by double digits. In 2014, IPS graduated 71.5% of its cohort while the state sat at 89.8%. The gap was 18.3 percentage points.
In 2025, IPS posted a 93.0% graduation rate — 1.2 points above the state average.
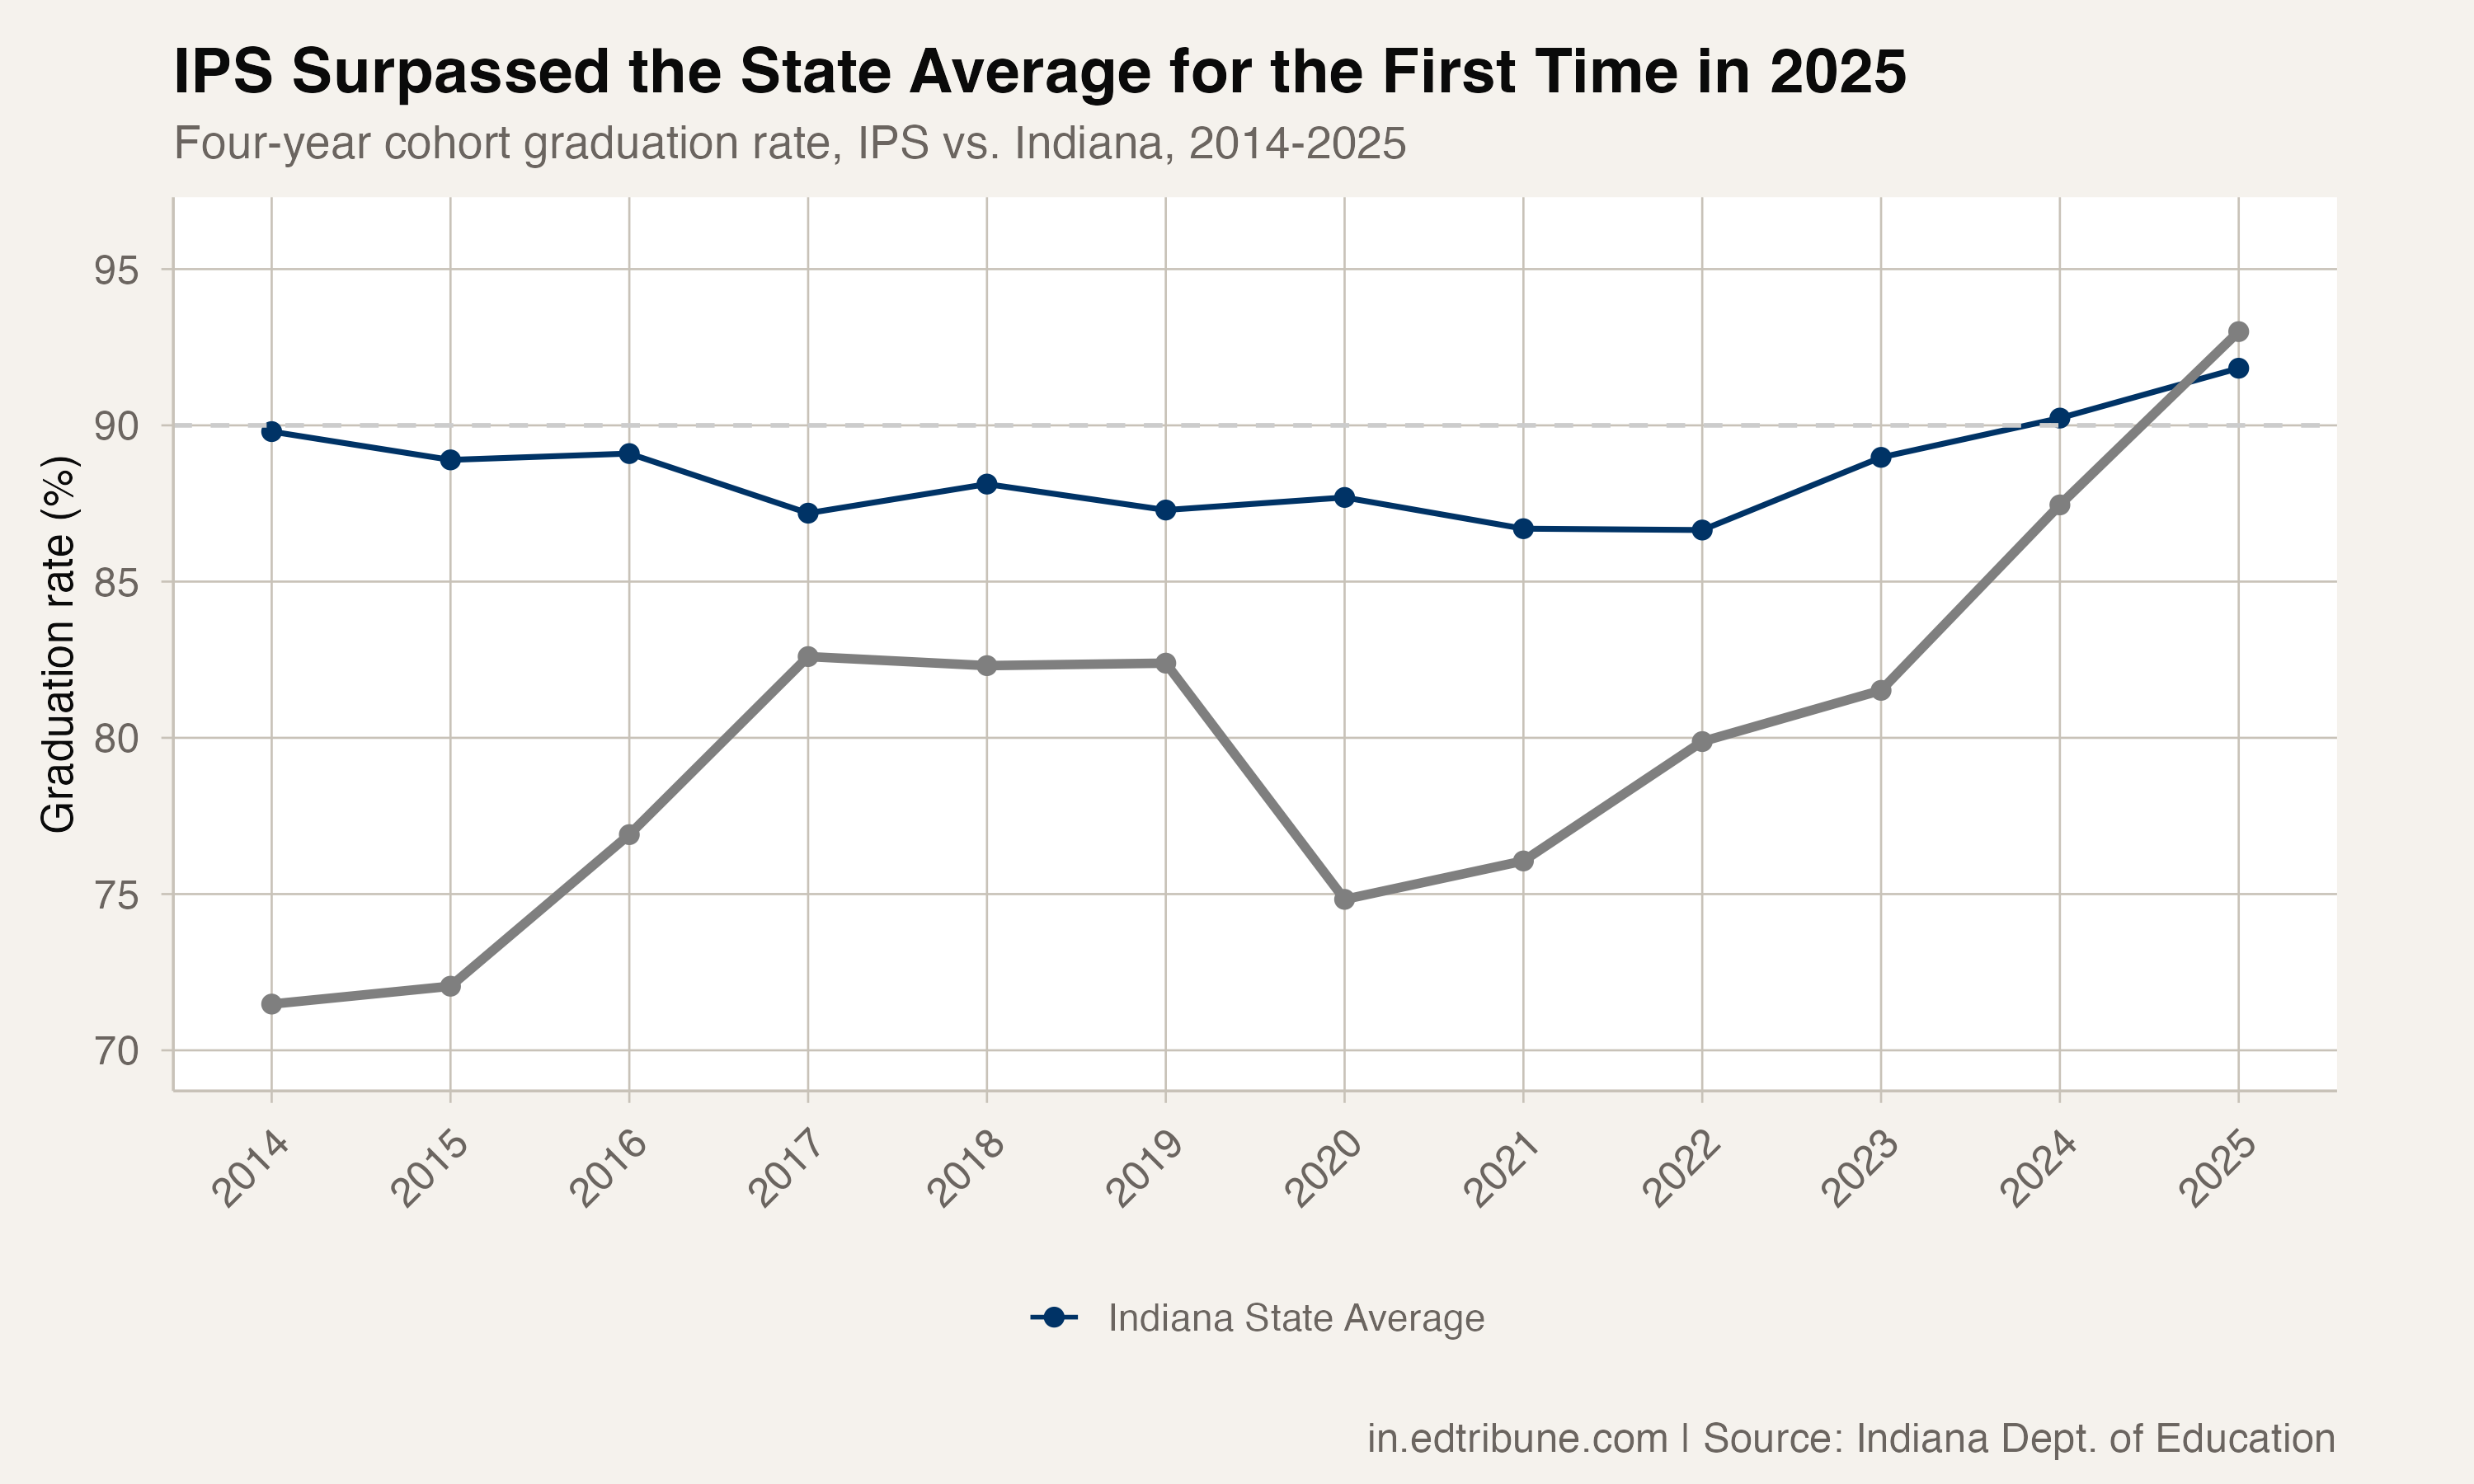
The crossover happened for the first time in the twelve years of IDOE data available. IPS did not merely catch up. It passed the state.
The trajectory in two acts
IPS's improvement did not follow a straight line. There were two distinct surges separated by a COVID-era collapse.
The first came between 2014 and 2017, when the rate climbed from 71.5% to 82.6% — an 11.1 percentage point gain in three years. Then it stalled. IPS hovered around 82% from 2017 through 2019 while the district underwent a major restructuring, handing management of several schools to charter operators under its innovation network model.
When the pandemic hit, IPS's rate cratered to 74.8% in 2020 — erasing nearly all of the prior decade's gains. The district's cohort had also grown substantially, from 1,086 students in 2017 to 1,625 in 2020, as IPS absorbed returning students and innovation network schools.
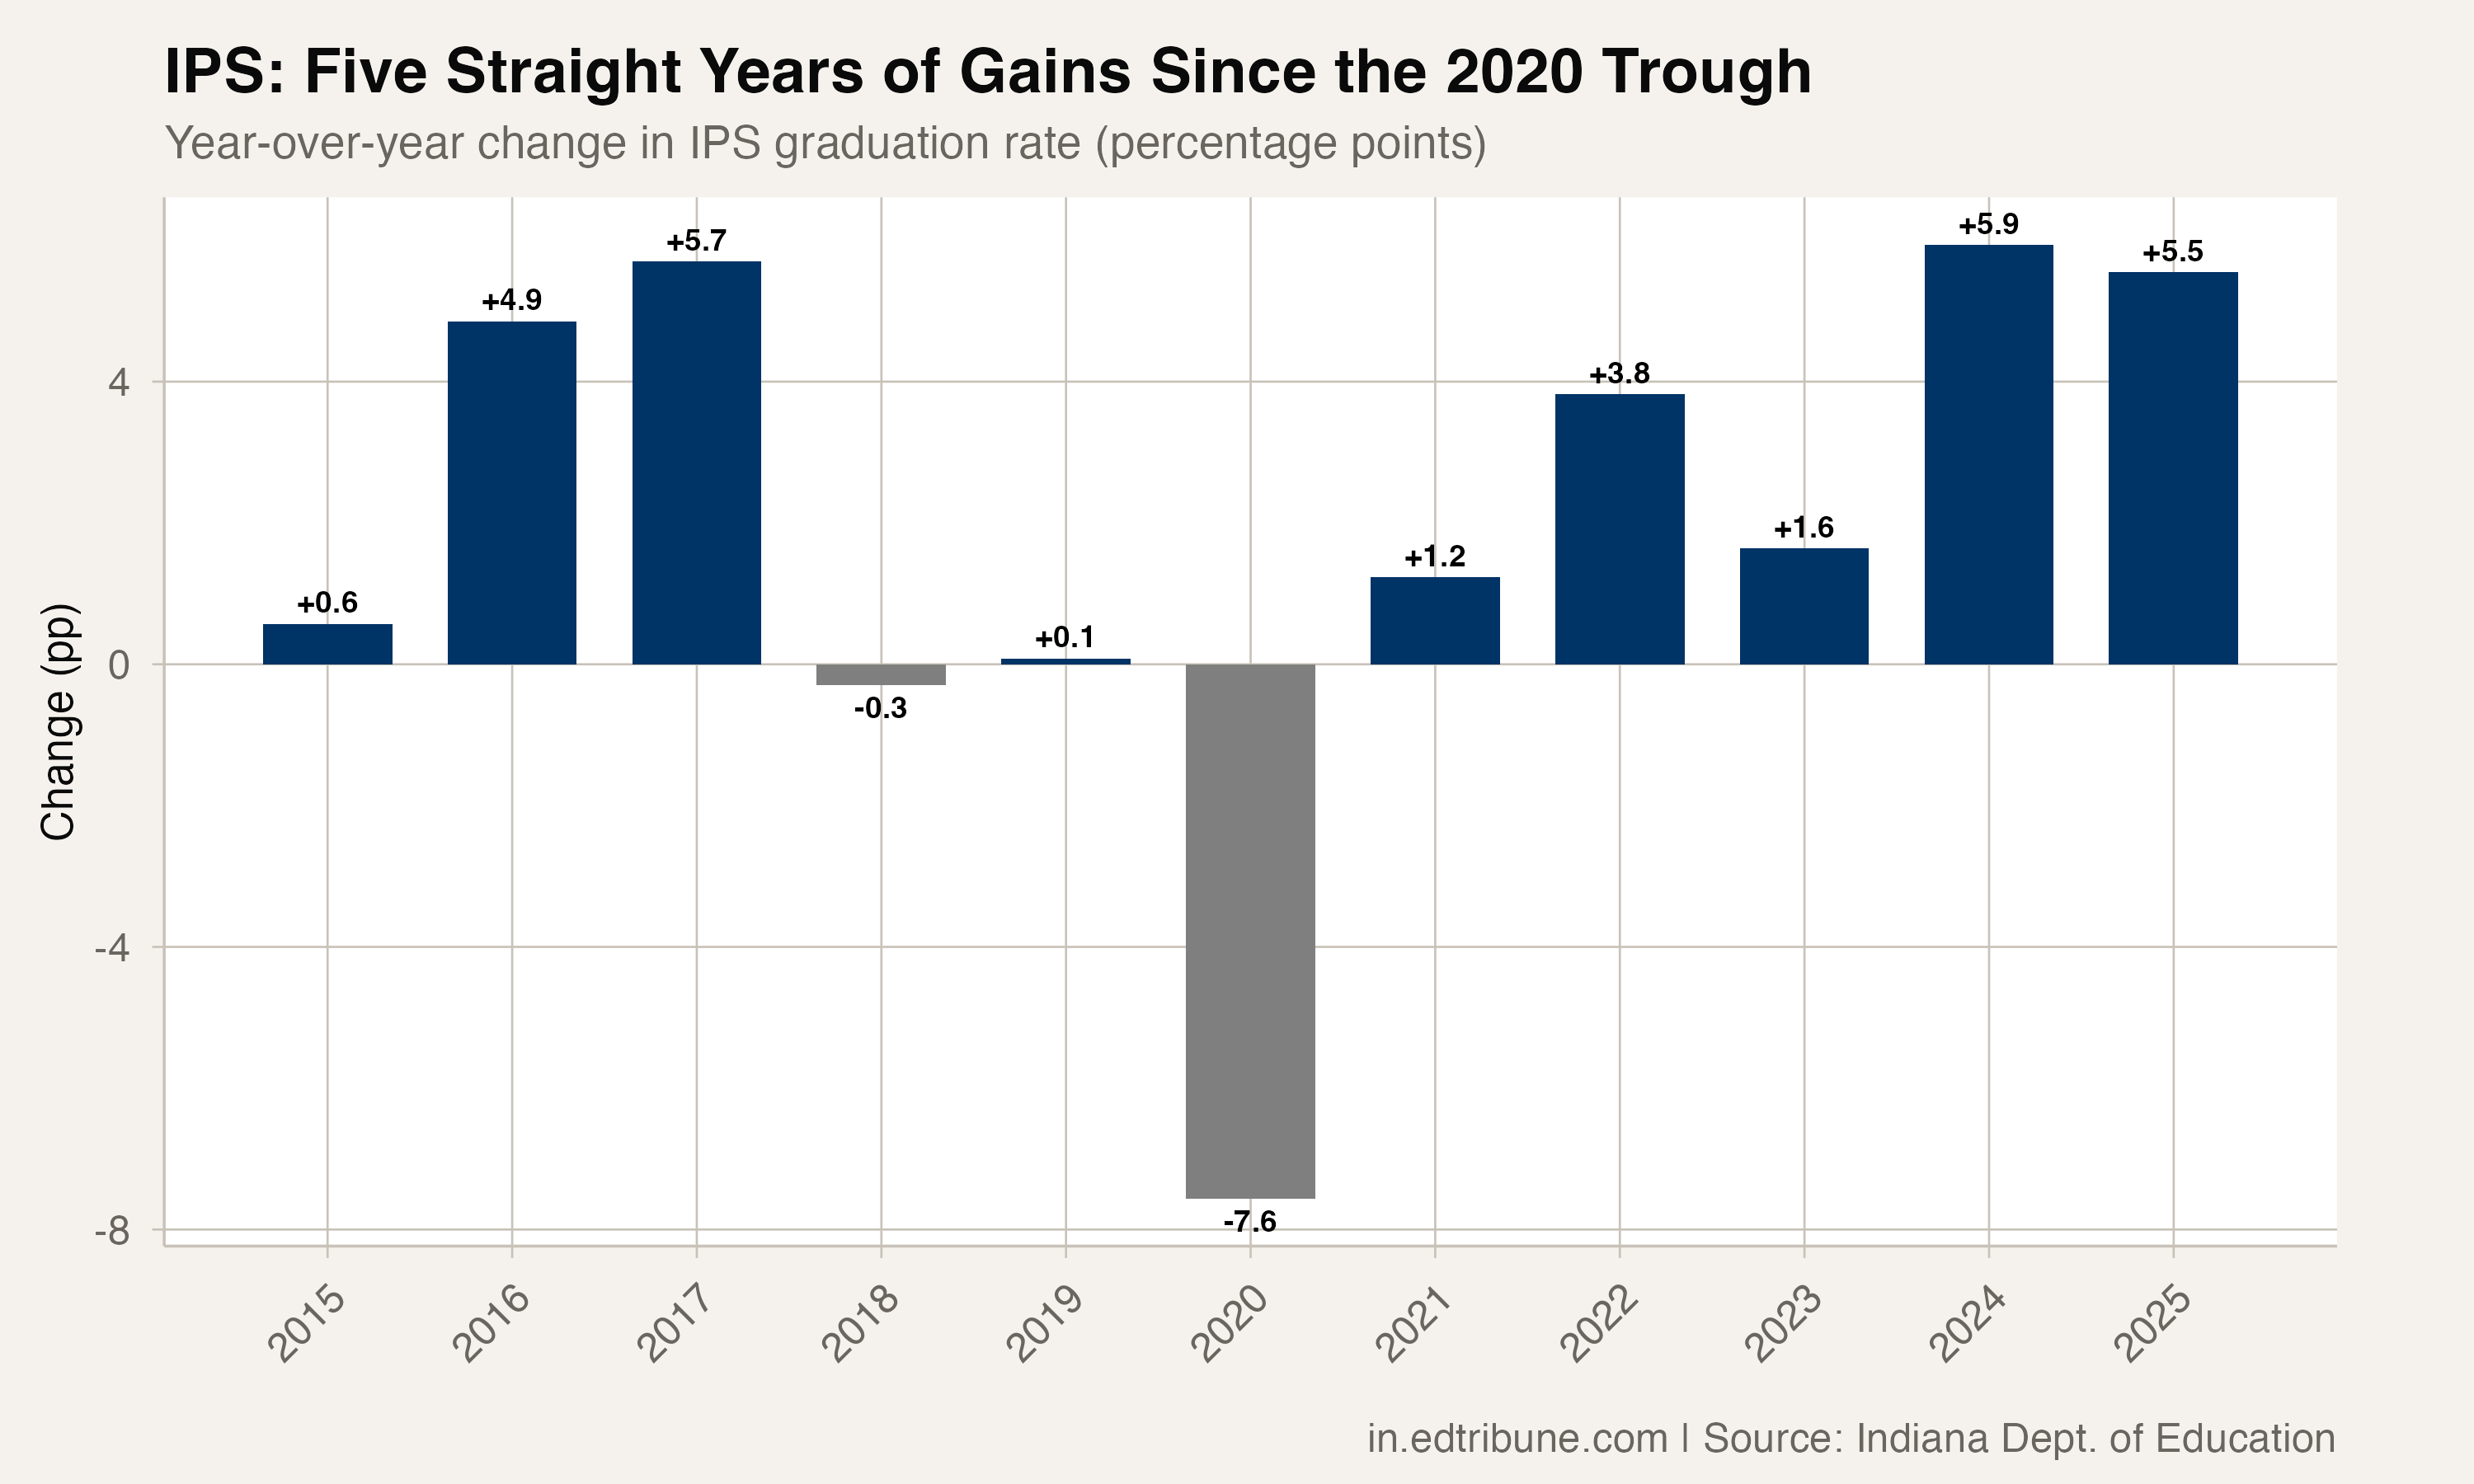
The second surge began in 2022 and has been even steeper. From 79.9% that year, IPS gained 13.1 percentage points in three years to reach 93.0% in 2025 — while the cohort grew to 2,043 students, the largest in the available data.
Every subgroup, above the state
What distinguishes the 2025 result from earlier IPS peaks is how broad-based it was.
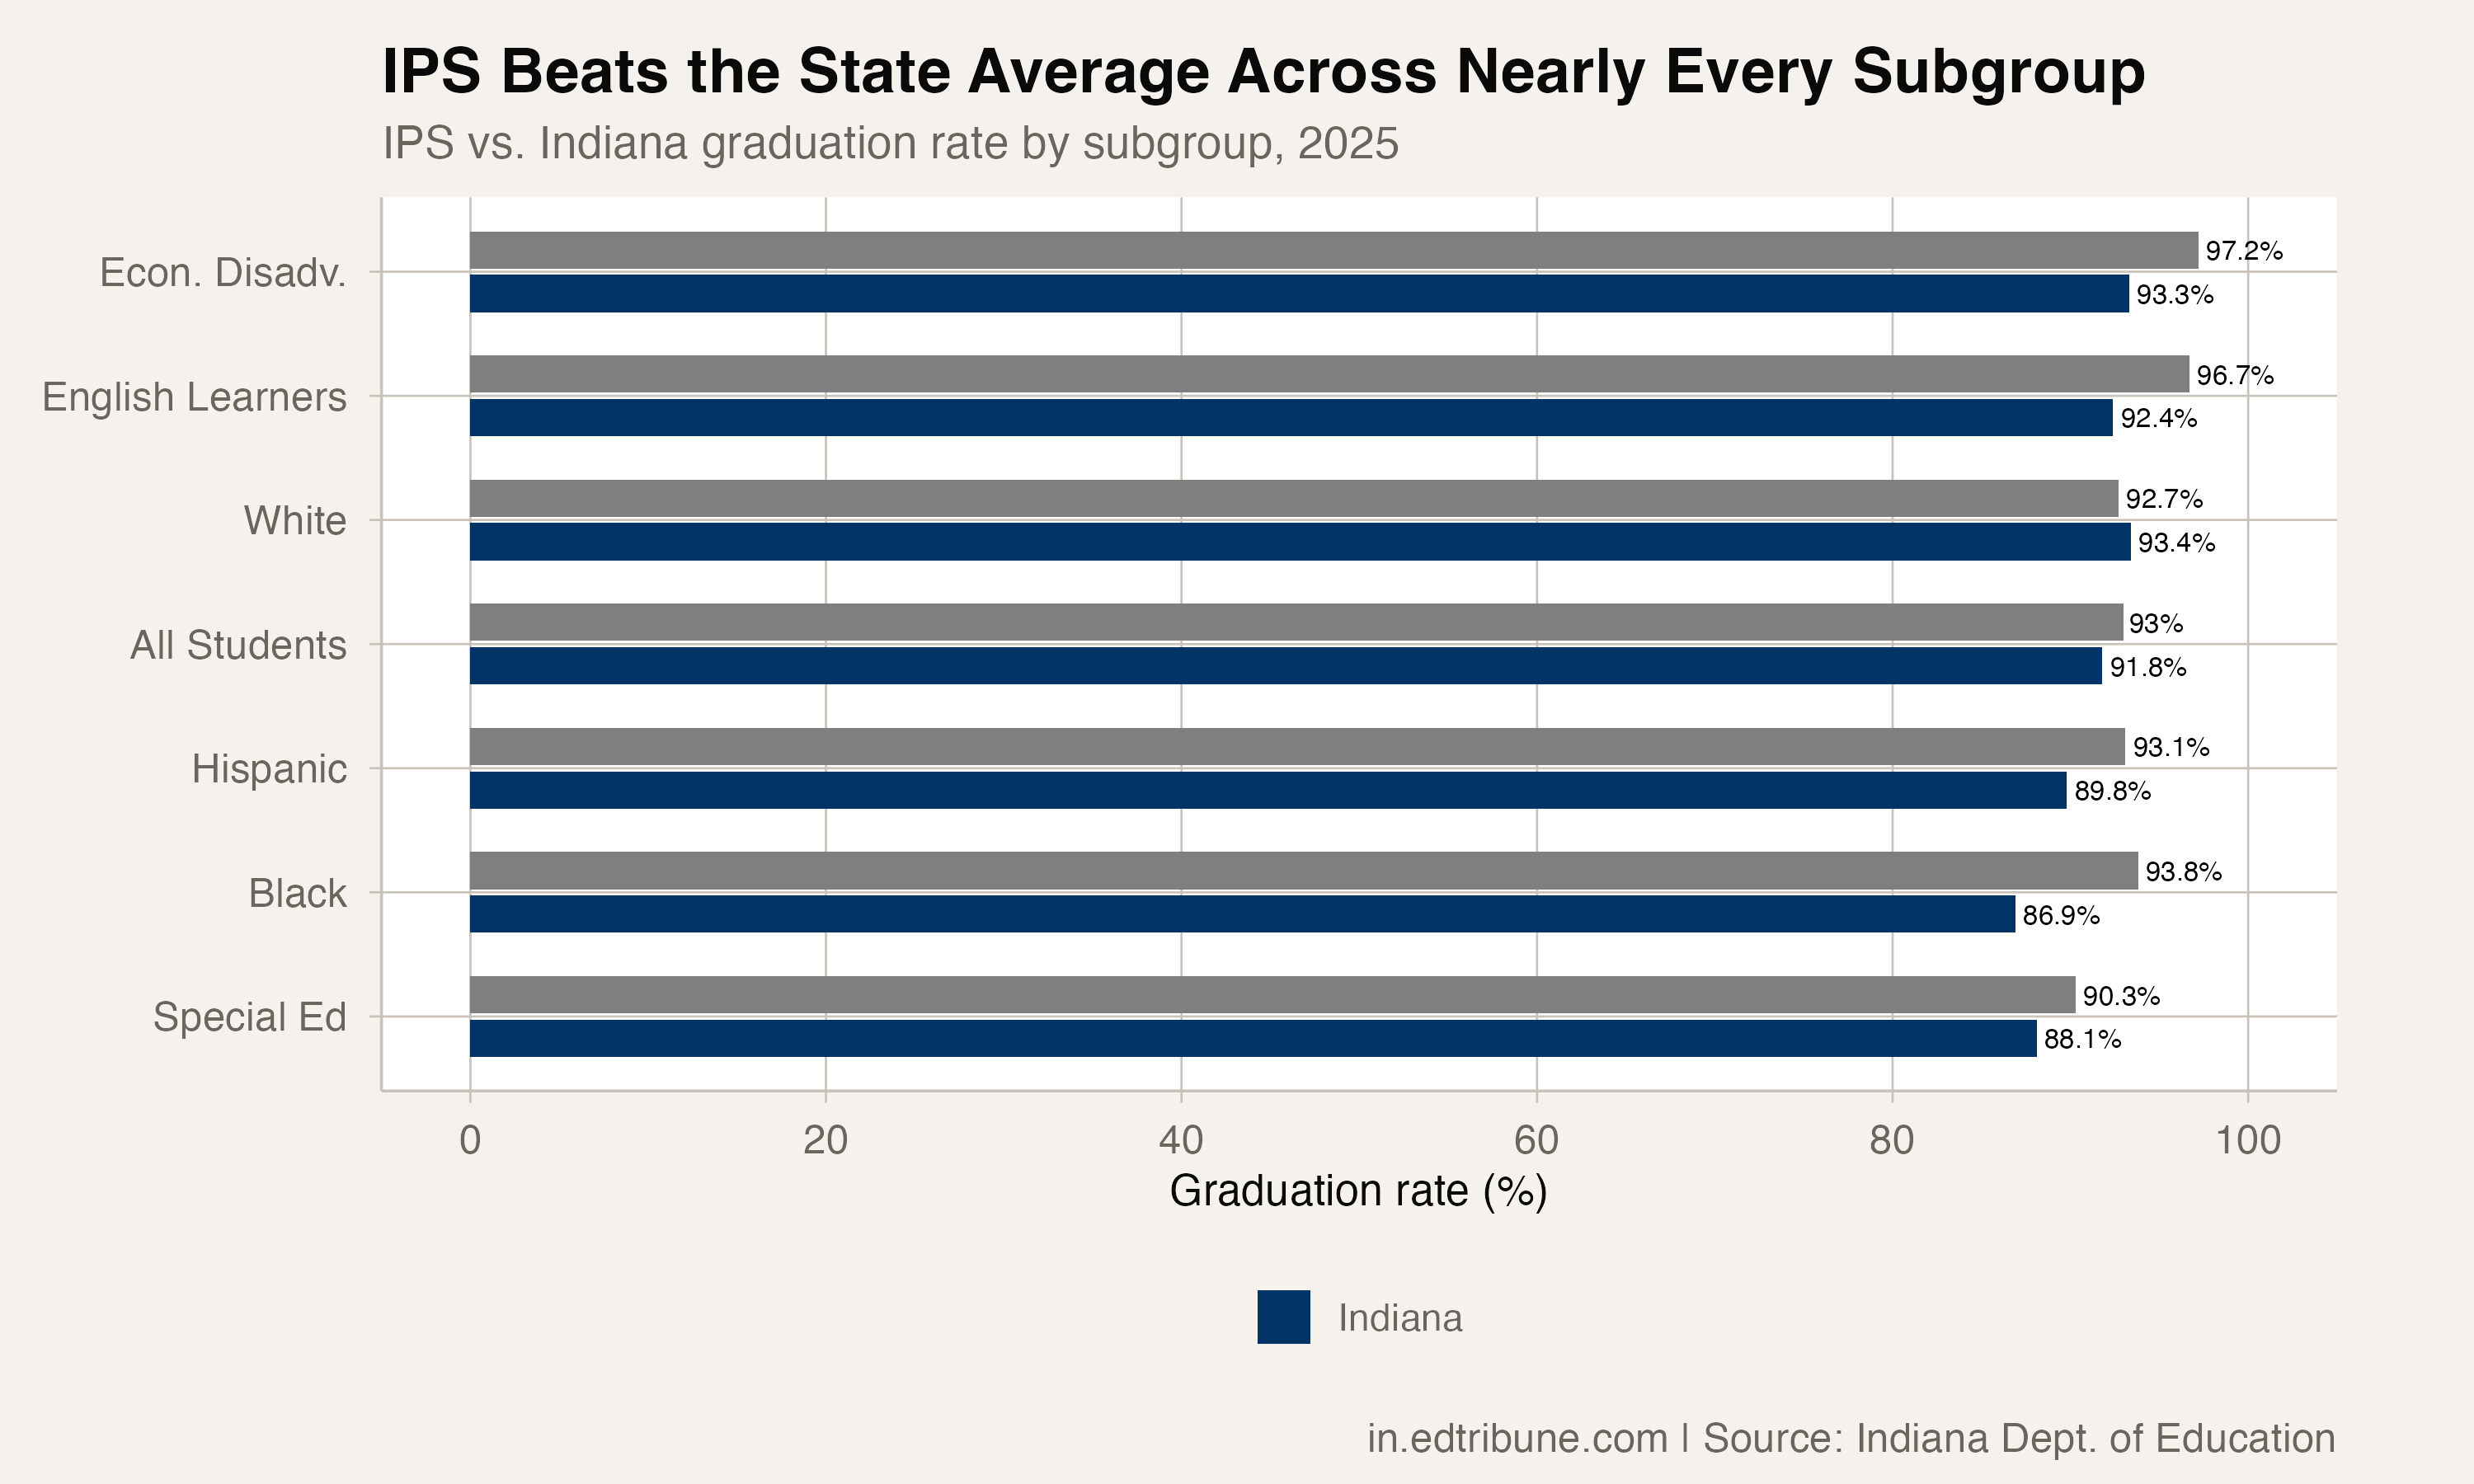
Black students at IPS graduated at 93.8% — nearly 7 percentage points above the statewide Black rate of 86.9%. Hispanic students hit 93.1%, topping the state's 89.8%. Special education students reached 90.3%, compared to 88.1% statewide. English learners graduated at 96.7%, the highest of any subgroup at IPS and more than 4 points above the state's already-exceptional LEP rate.
Economically disadvantaged students posted 97.2% at IPS, though that figure likely reflects the same CEP-broadened definition that inflates this subgroup statewide.
At the school level, every IPS high school with a reportable cohort exceeded 90%. Shortridge posted 97.1% on a cohort of 242. Crispus Attucks reached 96.8% on a cohort of 252. Arsenal Technical, IPS's largest high school with 558 in the cohort, hit 94.6%. George Washington came in at 90.1%.
The Black student story
Perhaps the most significant data point in the IPS transformation involves Black students, who make up the largest share of the district's enrollment. In 2021, only 73.7% of Black students at IPS graduated — a rate that put the district among the state's worst performers for this subgroup.
Four years later, that rate stands at 93.8%. The 20.1 percentage point gain is the steepest improvement for Black students at any large Indiana school corporation during this period. It means IPS Black students now graduate at a higher rate than the overall state average for all students.
The cohort question
One complication in reading IPS's trajectory: the cohort nearly doubled, from 1,086 in 2017 to 2,043 in 2025. Some of that growth reflects the innovation network model bringing charter-operated schools under the IPS umbrella. Some reflects demographic shifts. Some reflects changes in how students are counted in the cohort.
The growth matters because it changes who is being measured. A 93% rate for 2,043 students is a fundamentally different achievement than an 82% rate for 1,086 students. The district is graduating a higher percentage of a much larger and arguably more complex student body.
Innovation network or pathway engineering?
IPS has implemented graduation coaches, credit recovery programs, and the innovation network model that brought charter-operated schools under its umbrella. The federal graduation rate, which excludes waiver diplomas, is not published at the corporation level, so the waiver contribution at IPS specifically cannot be measured.
But a district that was 18 points below the state average a decade ago now sits above it, with every subgroup and every high school exceeding 90%. That happened while the cohort nearly doubled. Ten years ago, nobody in Indiana education would have predicted this trajectory. Now the question is whether IPS can hold it.
Detailed code that reproduces the analysis and figures in this article is available exclusively to EdTribune subscribers.
Discussion
Sign in to join the discussion.
Loading comments...