Correction (July 22, 2026): An earlier version reported the 2025 general-education/special-education gap as 6.7 points; fresh package output puts it at 6.6. It also said 12 corporations with special-education cohorts of 20 or more posted 100% rates; the current file contains 18. Unsupported claims about diploma pathways and the cause of the improvement were removed.
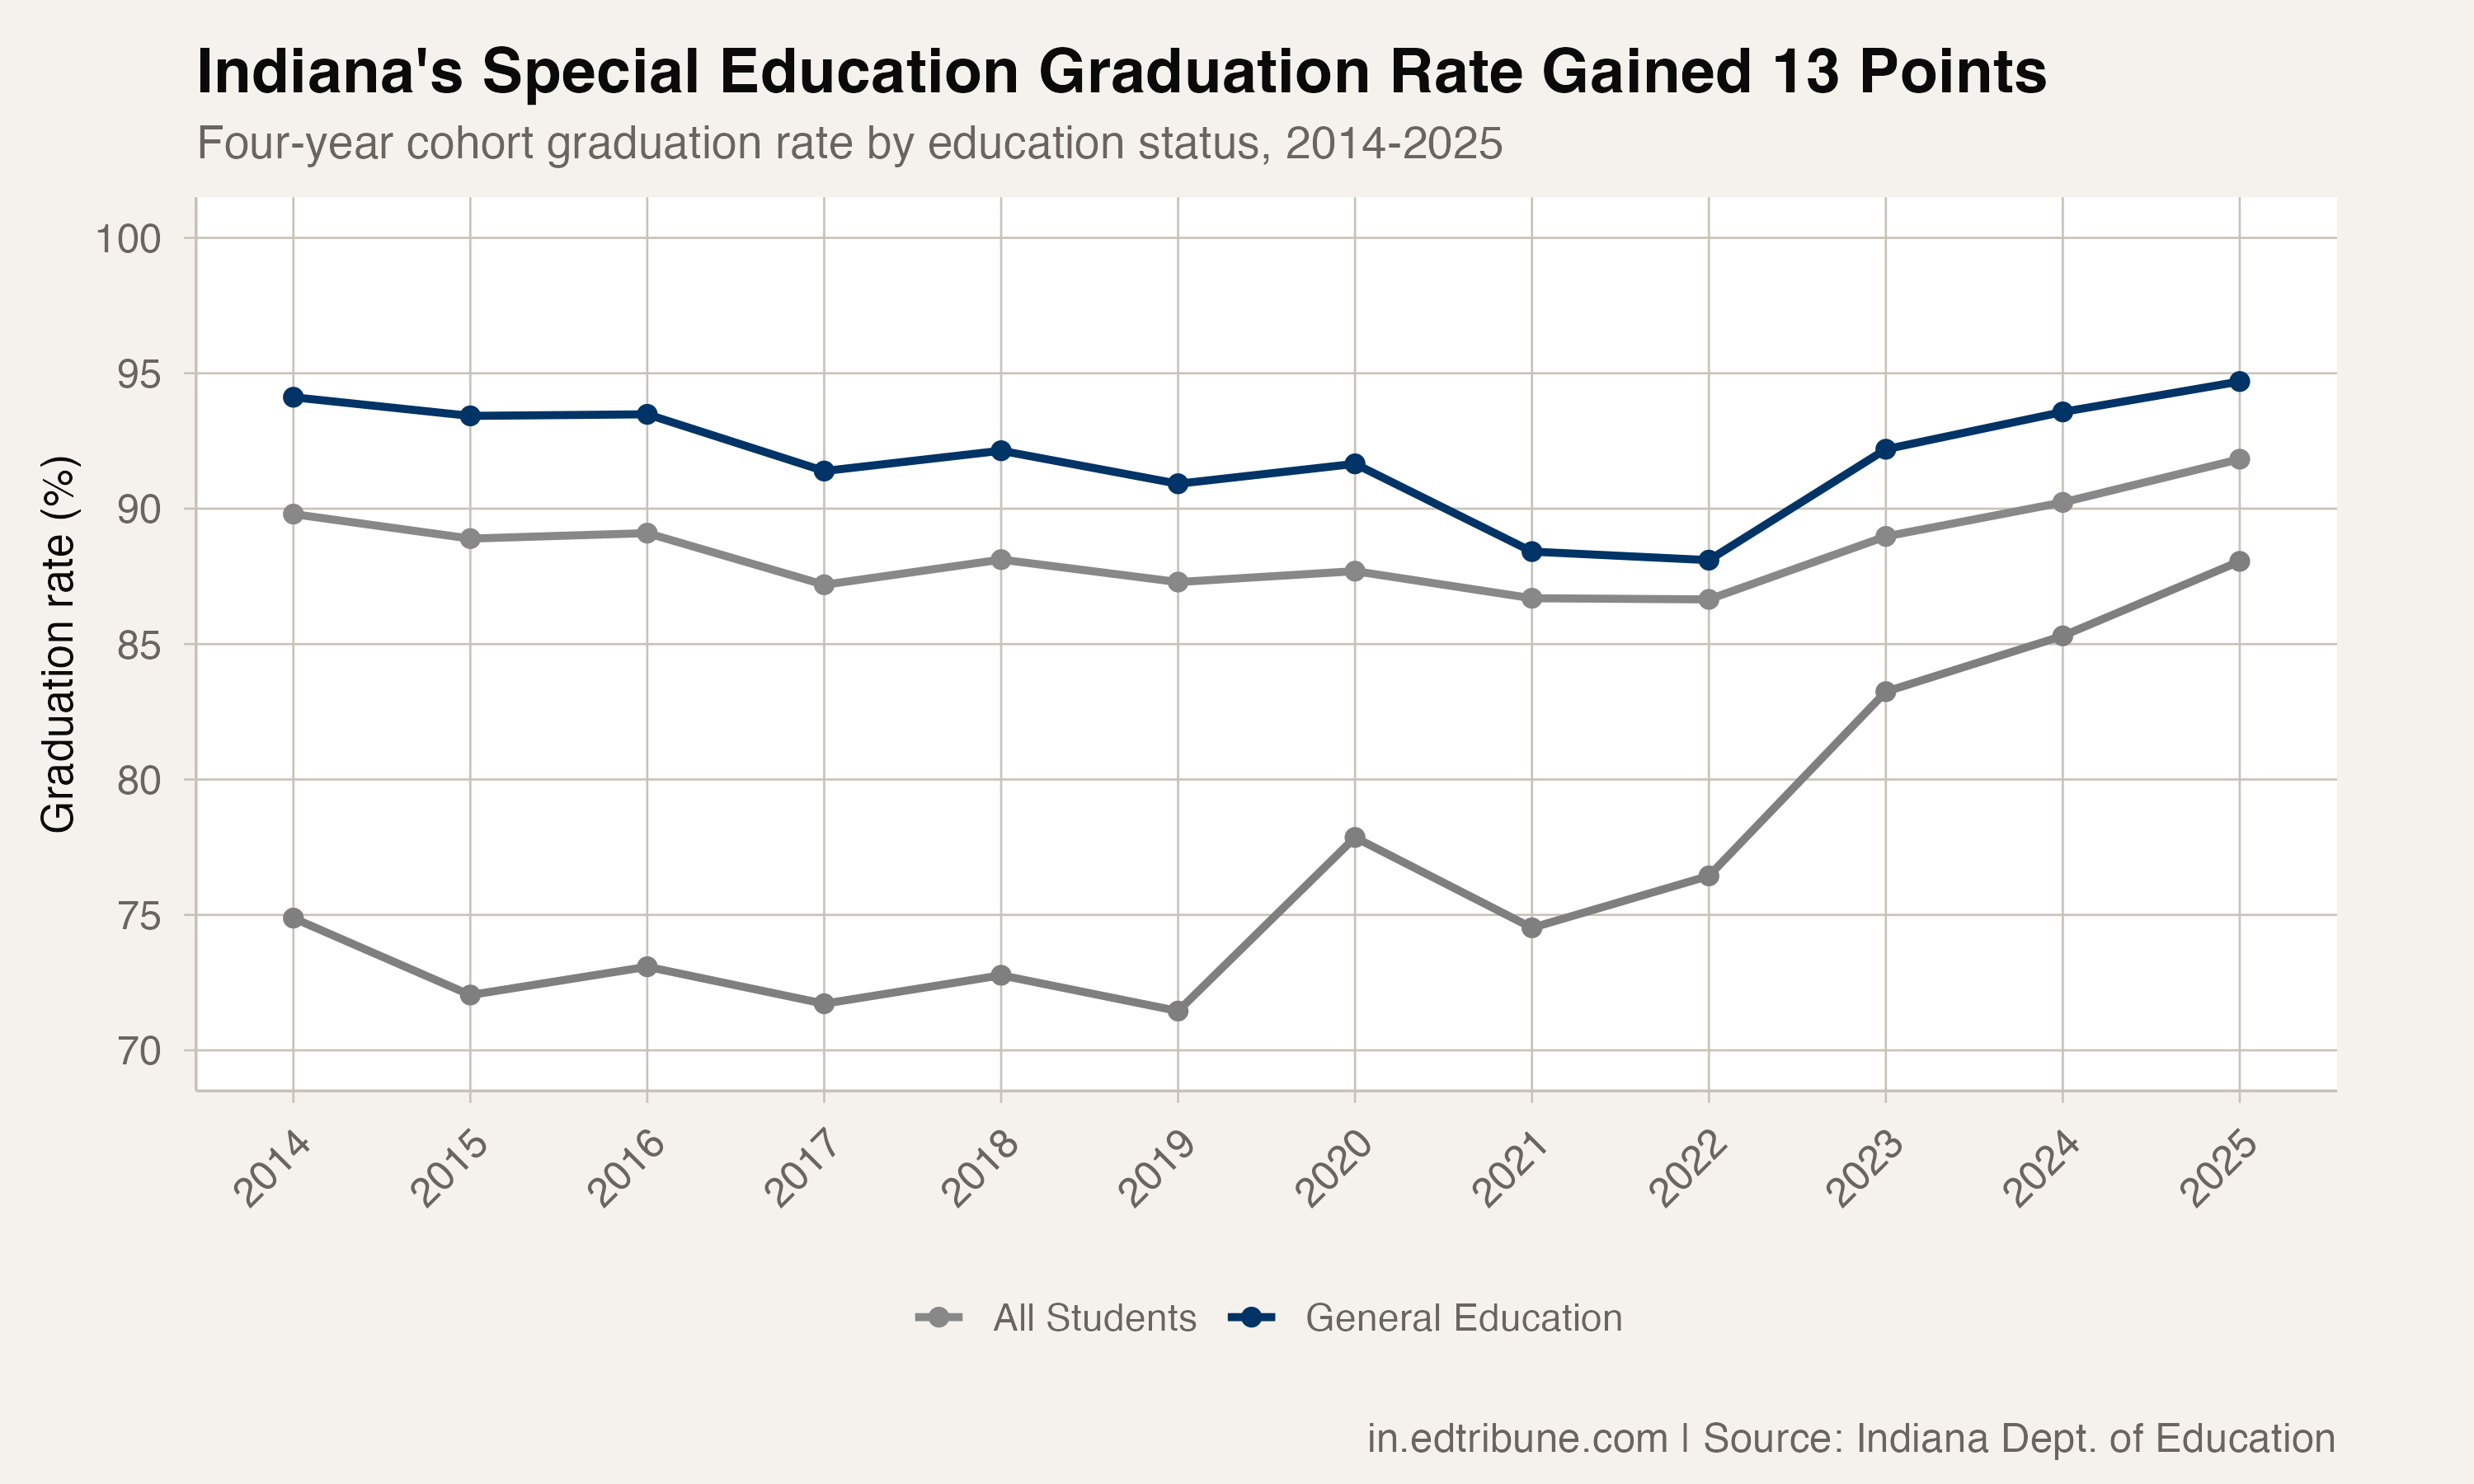
In 2014, Indiana's special education students graduated at 74.9% — 19.2 percentage points behind their general education peers.
By 2025, that gap had narrowed to 6.6 percentage points.
Special education students gained 13.2 percentage points over the period, reaching an 88.1% graduation rate. No other subgroup gained more. English learners gained 10.6 points. Black students gained 7.4. White students gained 1.7.
The largest gain belongs to the group that needed it most
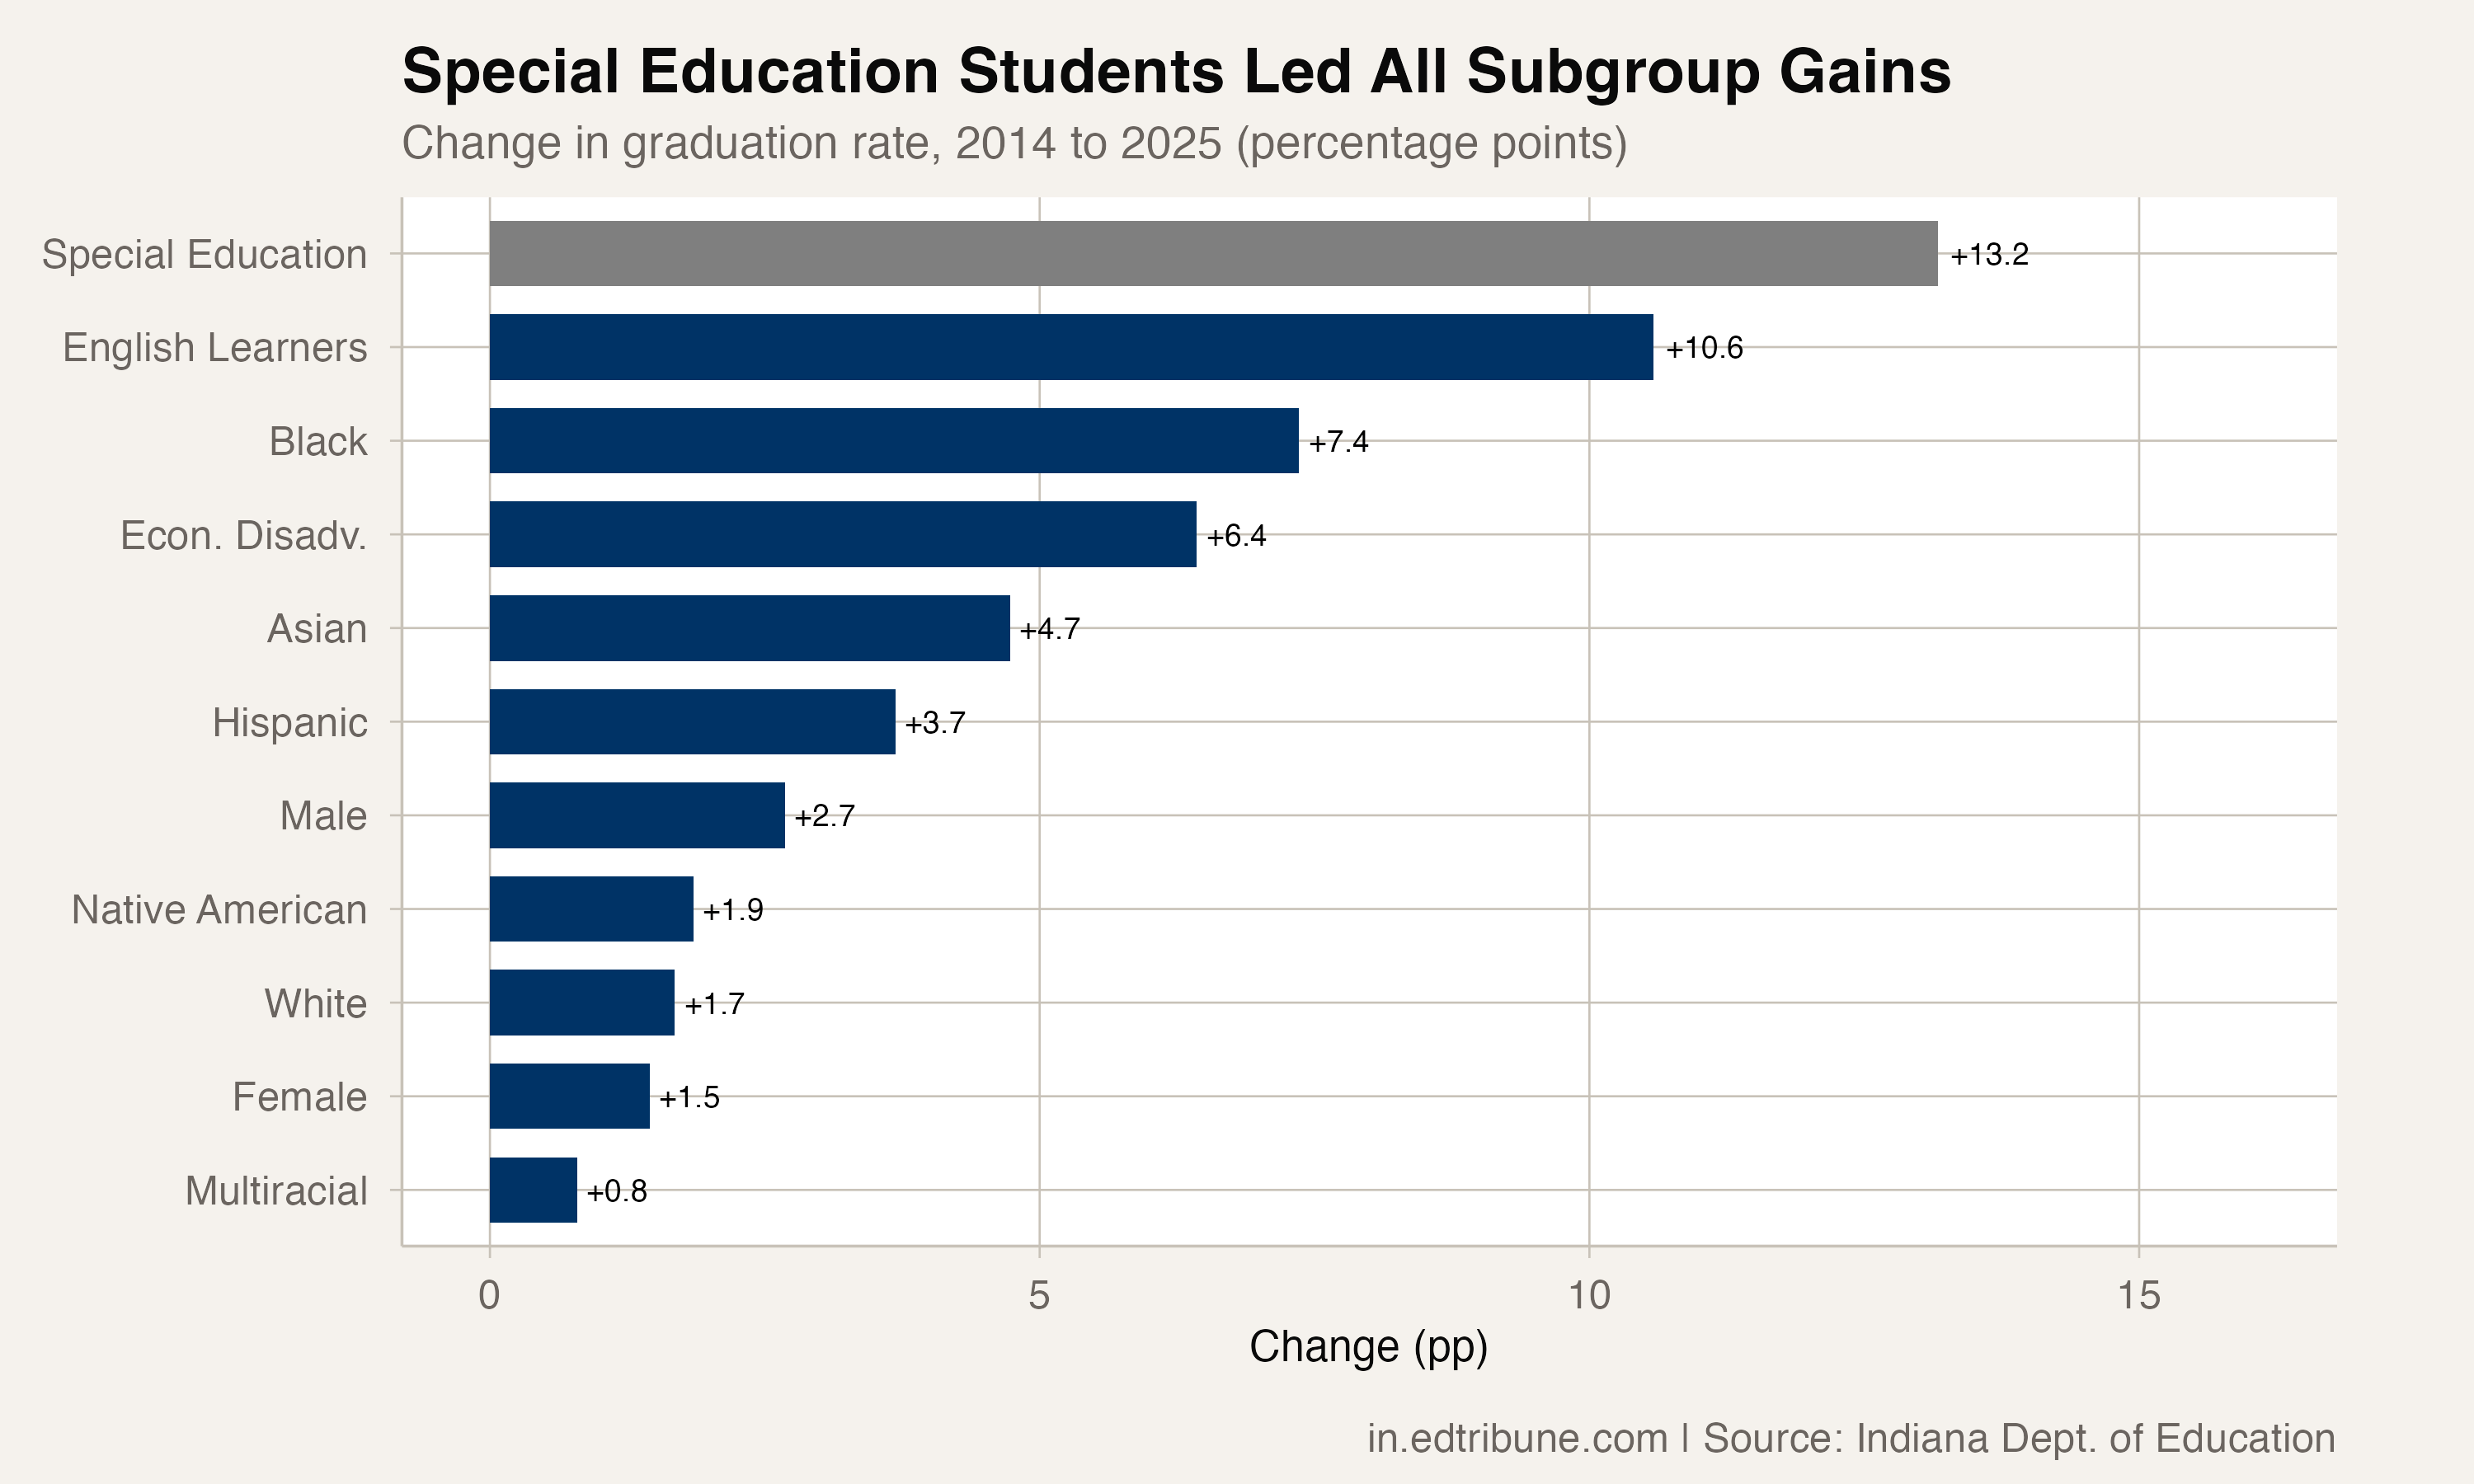
The 13.2 percentage point gain for special education students is the largest among the subgroups with comparable 2014 and 2025 values in the package output.
Indiana's special education rate ranged from 71.4% to 74.9% from 2014 through 2019. It rose to 77.9% in 2020, fell to 74.5% in 2021, and then climbed — 76.4% in 2022, 83.2% in 2023, 85.3% in 2024, and 88.1% in 2025.
The aggregate graduation file establishes the change but does not identify its cause.
The gap that shrank the fastest
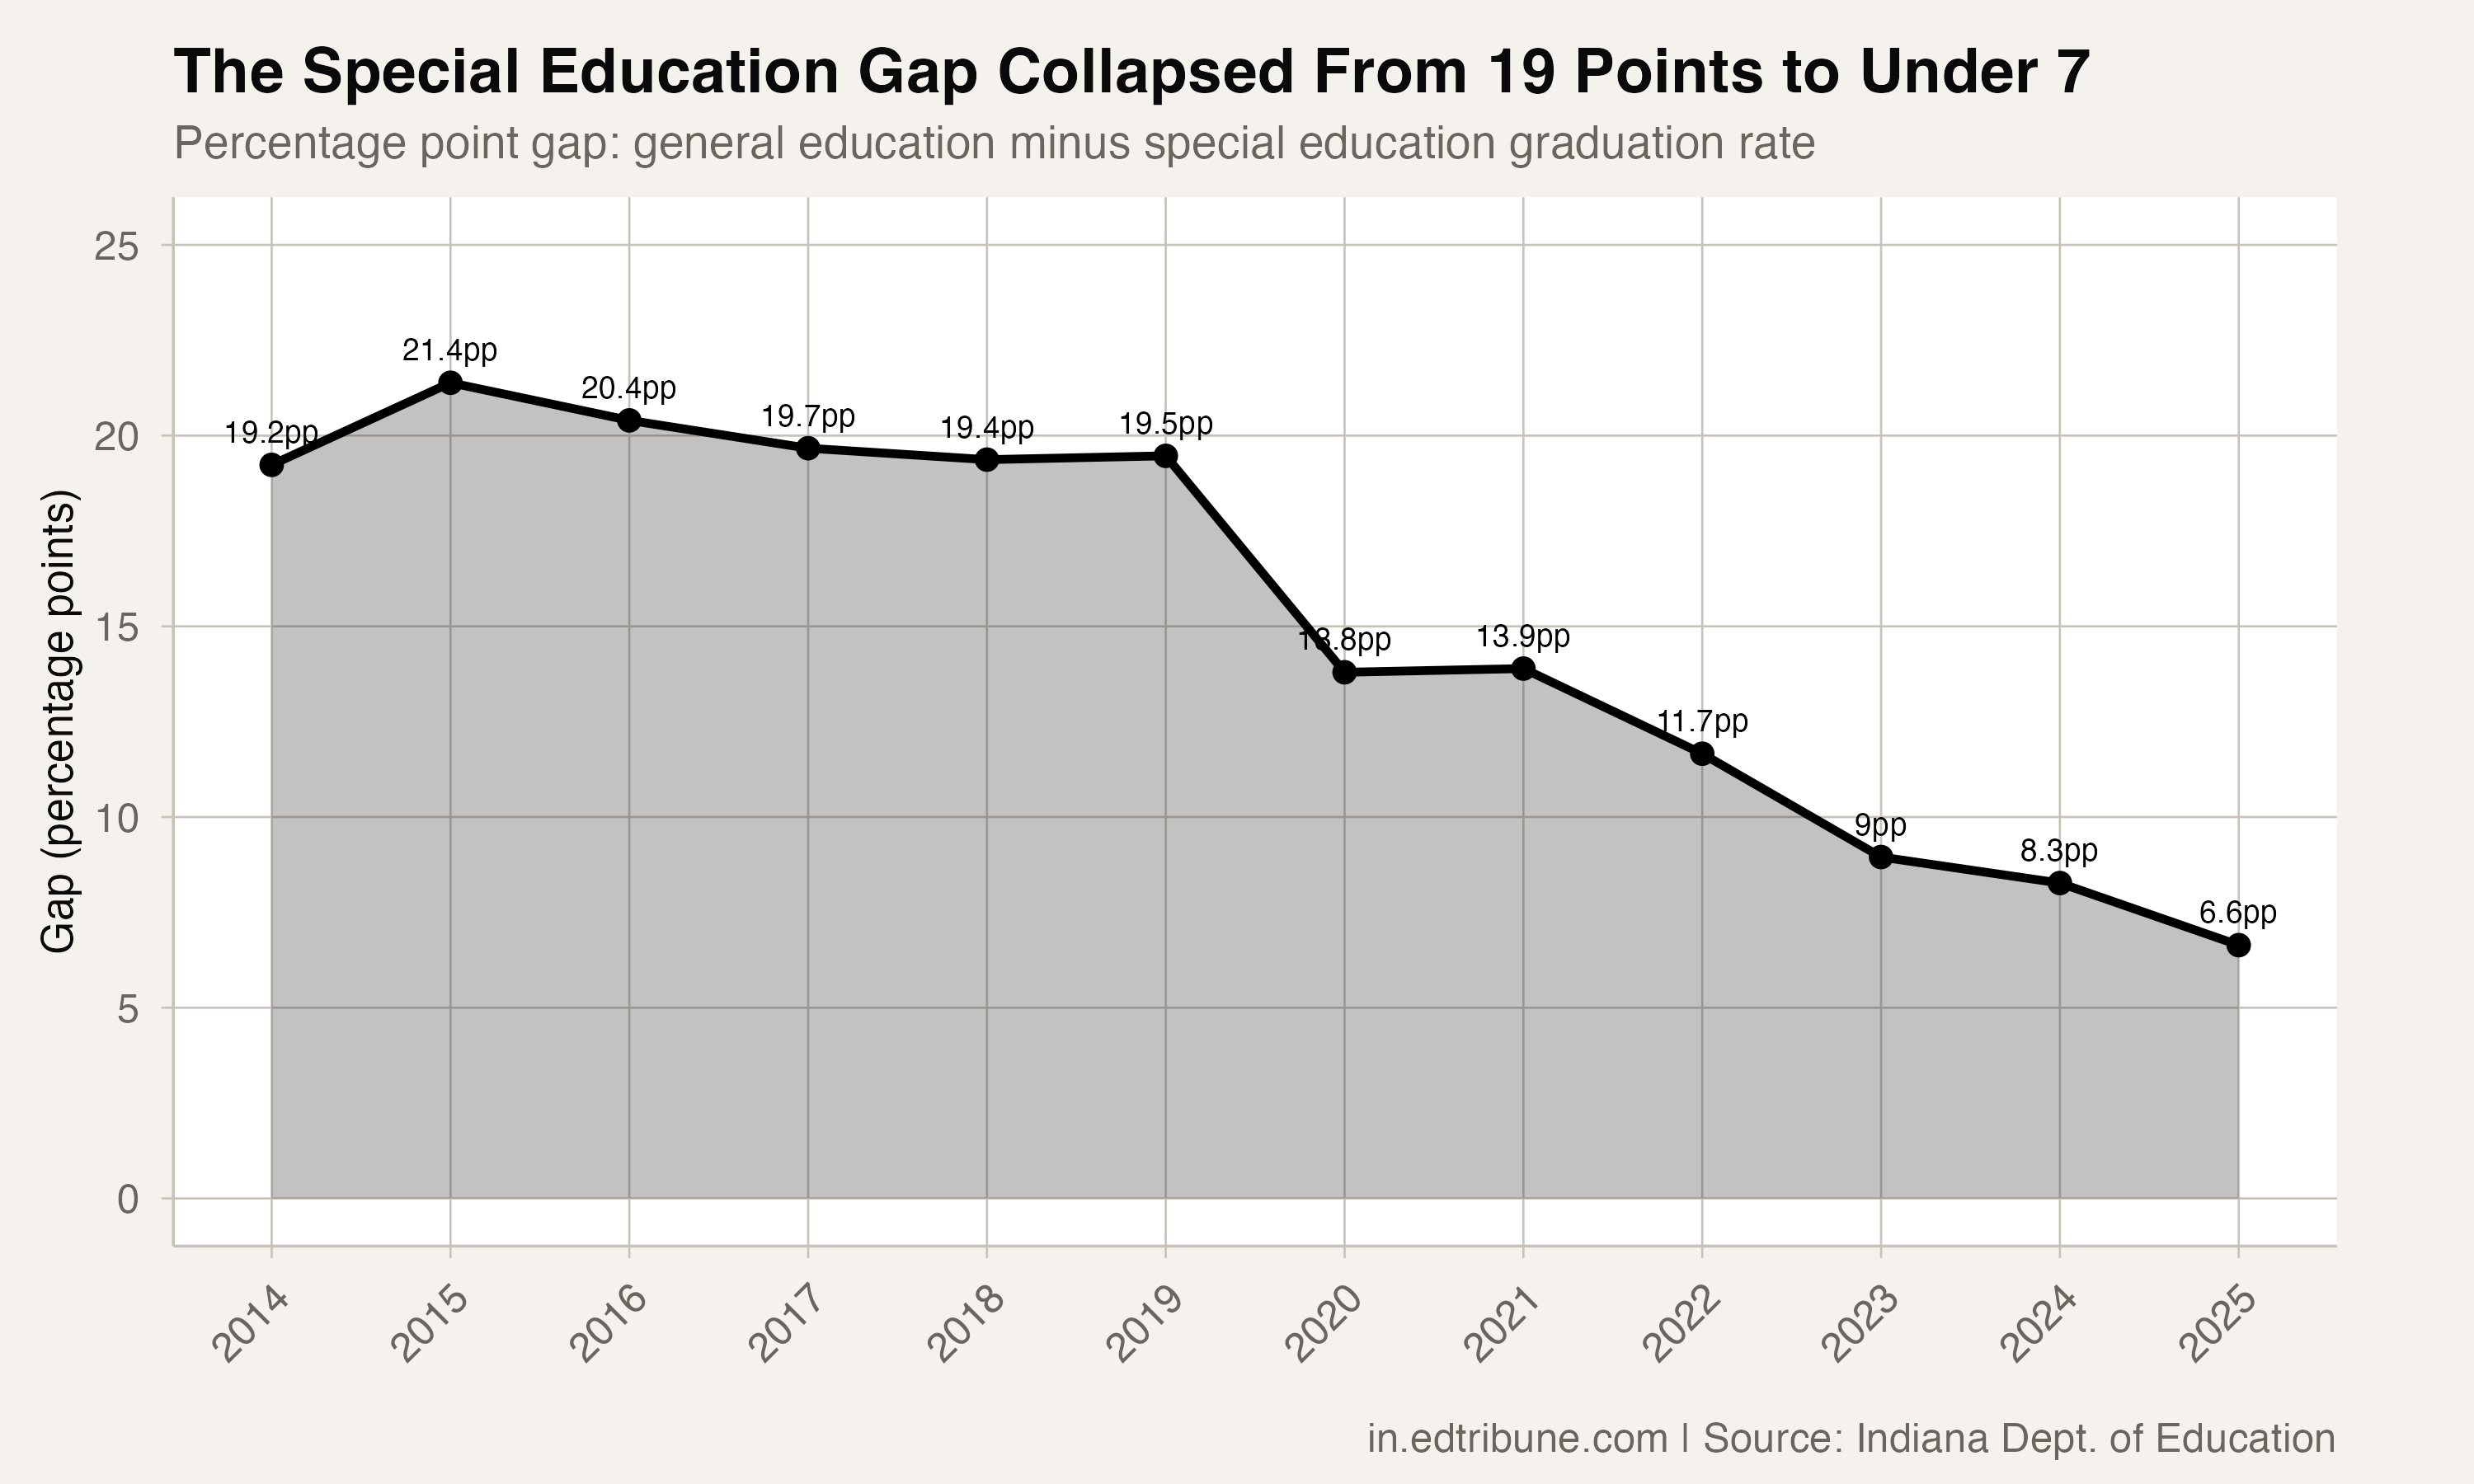
The general education-special education gap ranged from 19.2 to 21.4 percentage points from 2014 through 2019. Then it dropped to 13.8 points in 2020, rose to 13.9 in 2021, and resumed its decline: 11.7 in 2022, 9.0 in 2023, 8.3 in 2024, and 6.6 in 2025.
General education students improved 0.6 points, from 94.1% to 94.7%, while special education students gained 13.2 points. The gap contracted by 12.6 points.
At the corporation level, the results vary enormously. Eighteen school corporations with special education cohorts of 20 or more graduated 100% of their special education students in 2025, including Bartholomew Con School Corp (83 students), Seymour Community Schools (58), Sunman-Dearborn (55), and School City of East Chicago (50).
At the other end, Gary Community School Corp graduated just 41.3% of its special education cohort. Anderson Community sat at 61.5%. Monroe County Community at 74.4%.
The package output does not break graduation results out by diploma pathway, so it cannot show how much any particular pathway contributed to the statewide change.
In 2014, 25.1% of special education students in the cohort did not graduate on time. In 2025, that share was 11.9%. Over the same period, the general-education/special-education gap fell from 19.2 points to 6.6.
Detailed code that reproduces the analysis and figures in this article is available exclusively to EdTribune subscribers.
Discussion
Sign in to join the discussion.
Loading comments...