Correction (July 22, 2026): An earlier version understated the Native American graduation-rate gain as 1.8 percentage points and overstated the 2025 white-Native American gap as 6.7 points. The package-derived values are 1.9 and 6.6 points. The article also incorrectly said every other major racial gap narrowed; Indiana's white-multiracial gap widened from 4.0 to 4.9 points. It also incorrectly identified multiracial students as the only racial group with a smaller endpoint gain than Native American students; white students gained 1.7 points.
Black and Hispanic students made clear graduation gains in Indiana between 2014 and 2025. Black students gained 7.4 percentage points. Hispanic students gained 3.7.
Native American students gained 1.9 points. Multiracial students gained 0.8 point and white students gained 1.7 points; those were the two smaller gains among the six racial groups in this comparison.
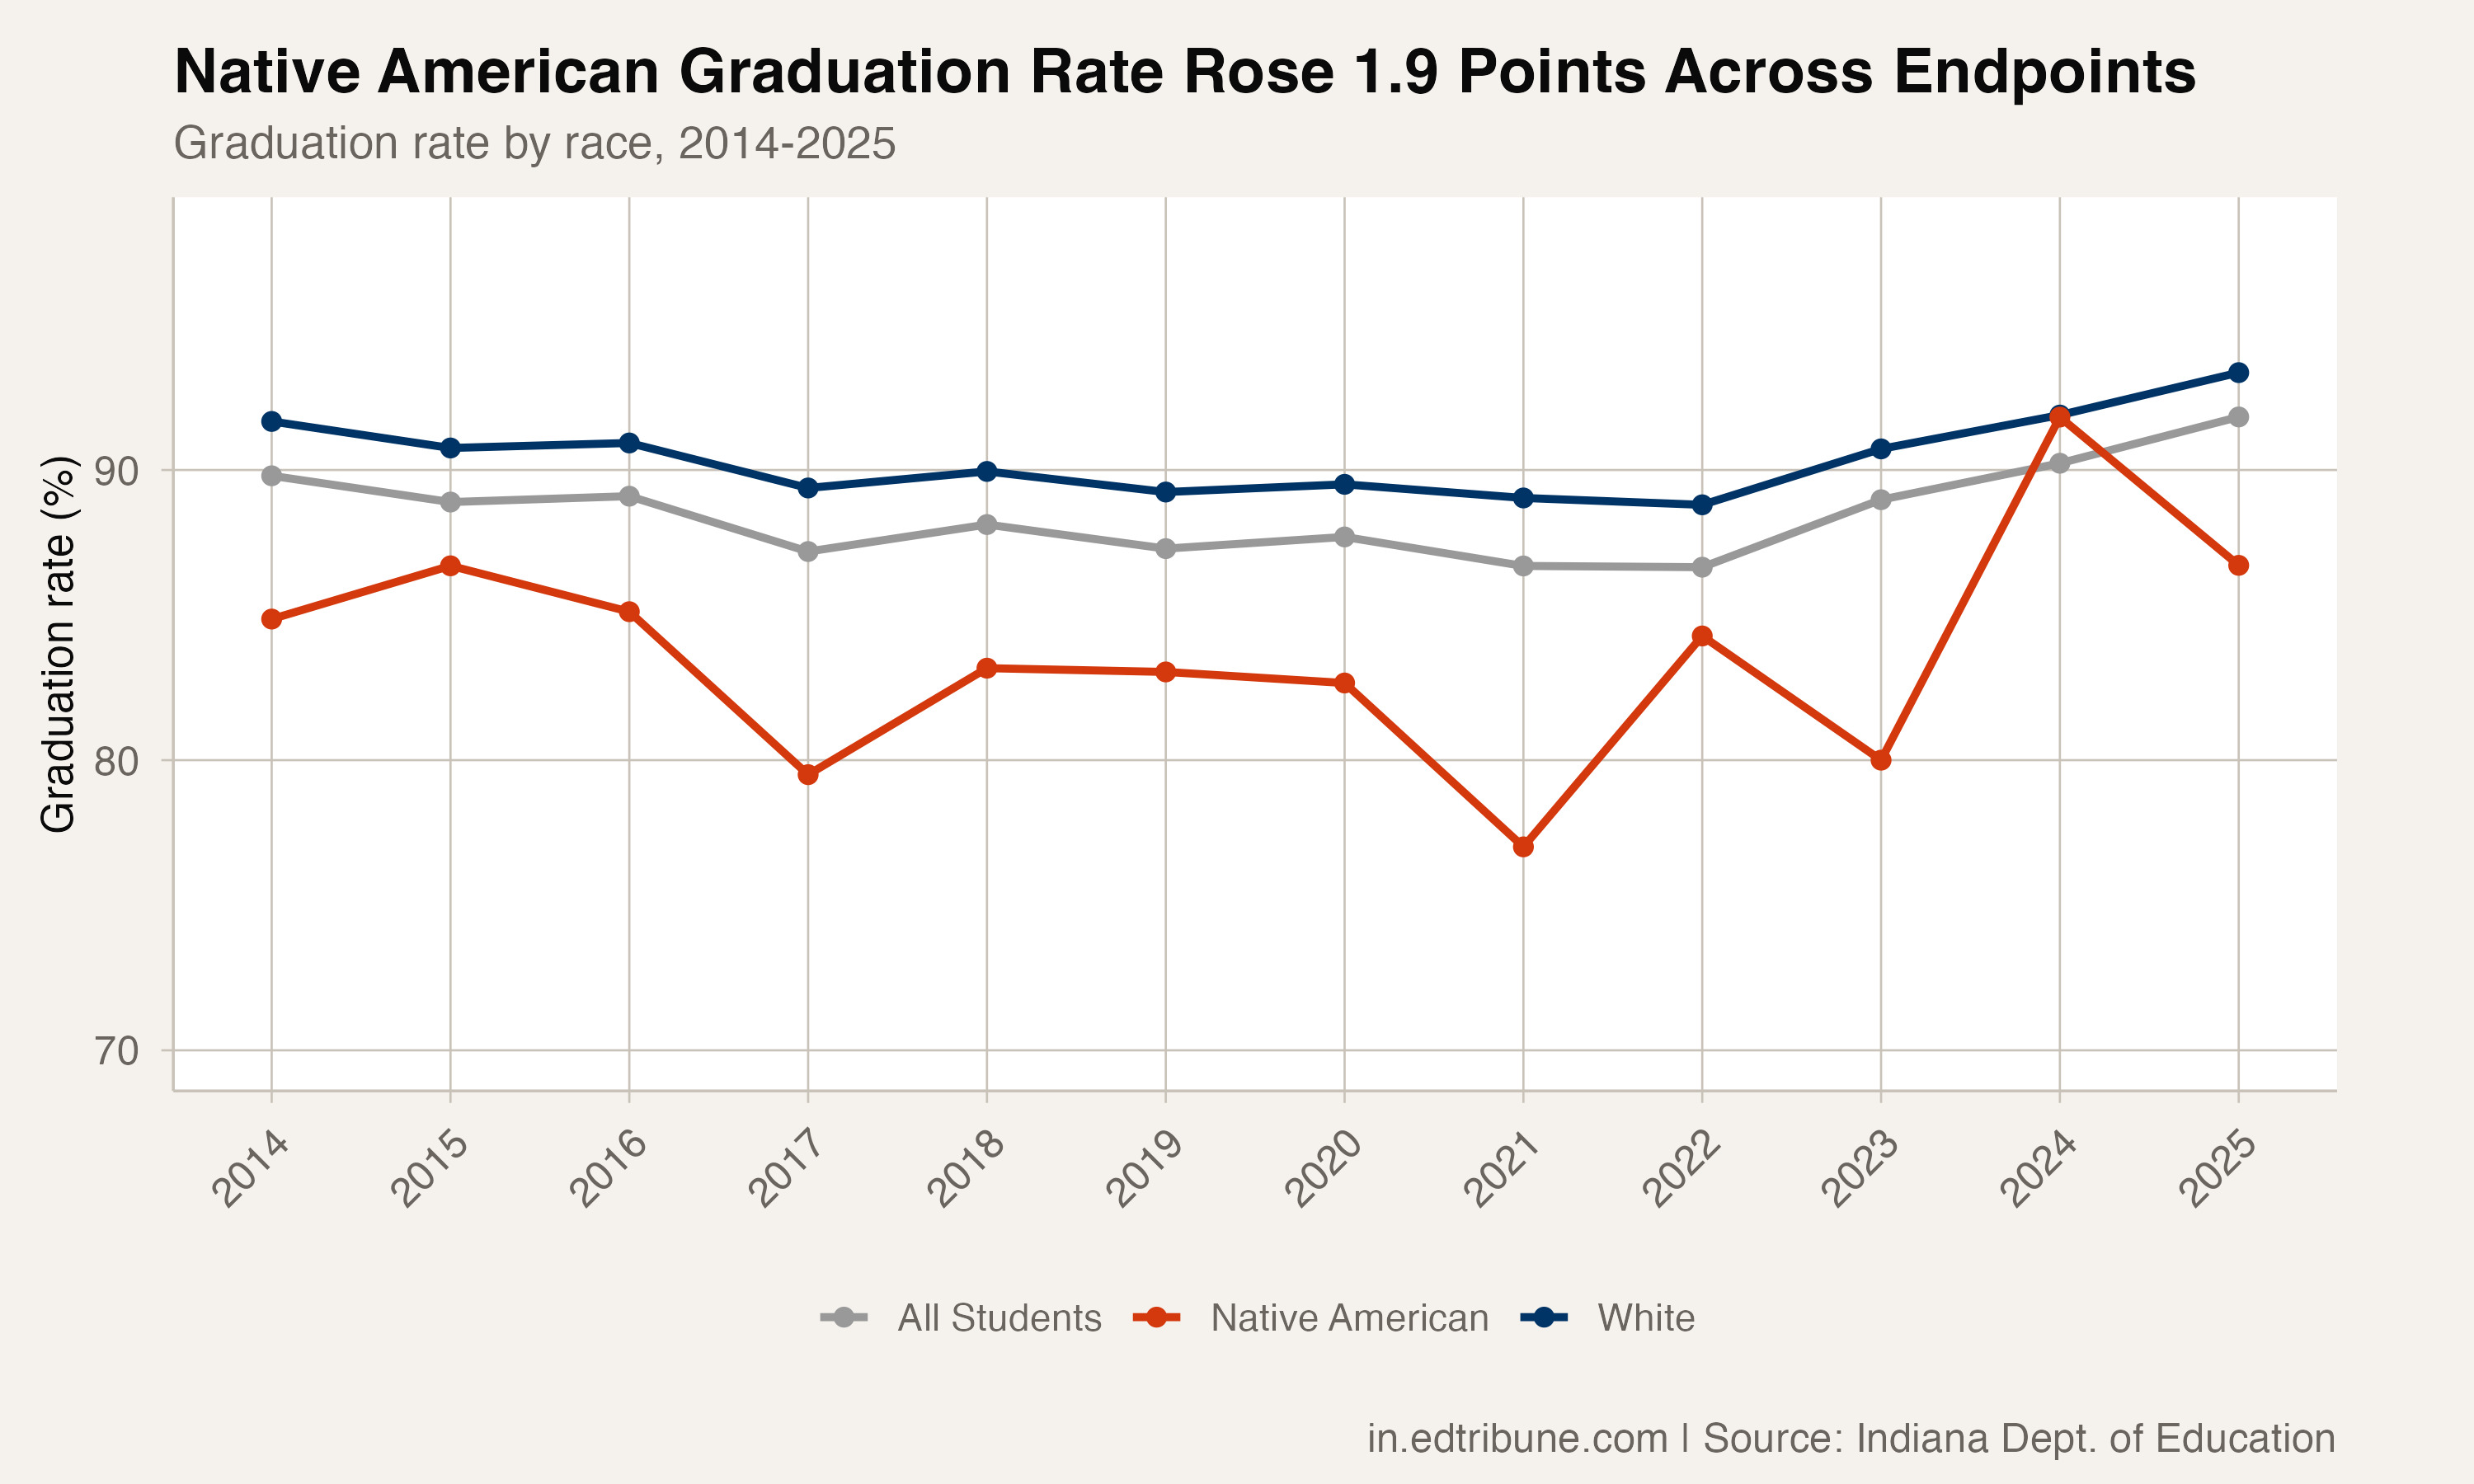
At 86.7%, Native American students have the lowest reported graduation rate of any racial group in Indiana, just below Black students at 86.9%. The white-Native American gap narrowed only 0.2 point, from 6.8 points in 2014 to 6.6 in 2025.
Larger gains elsewhere
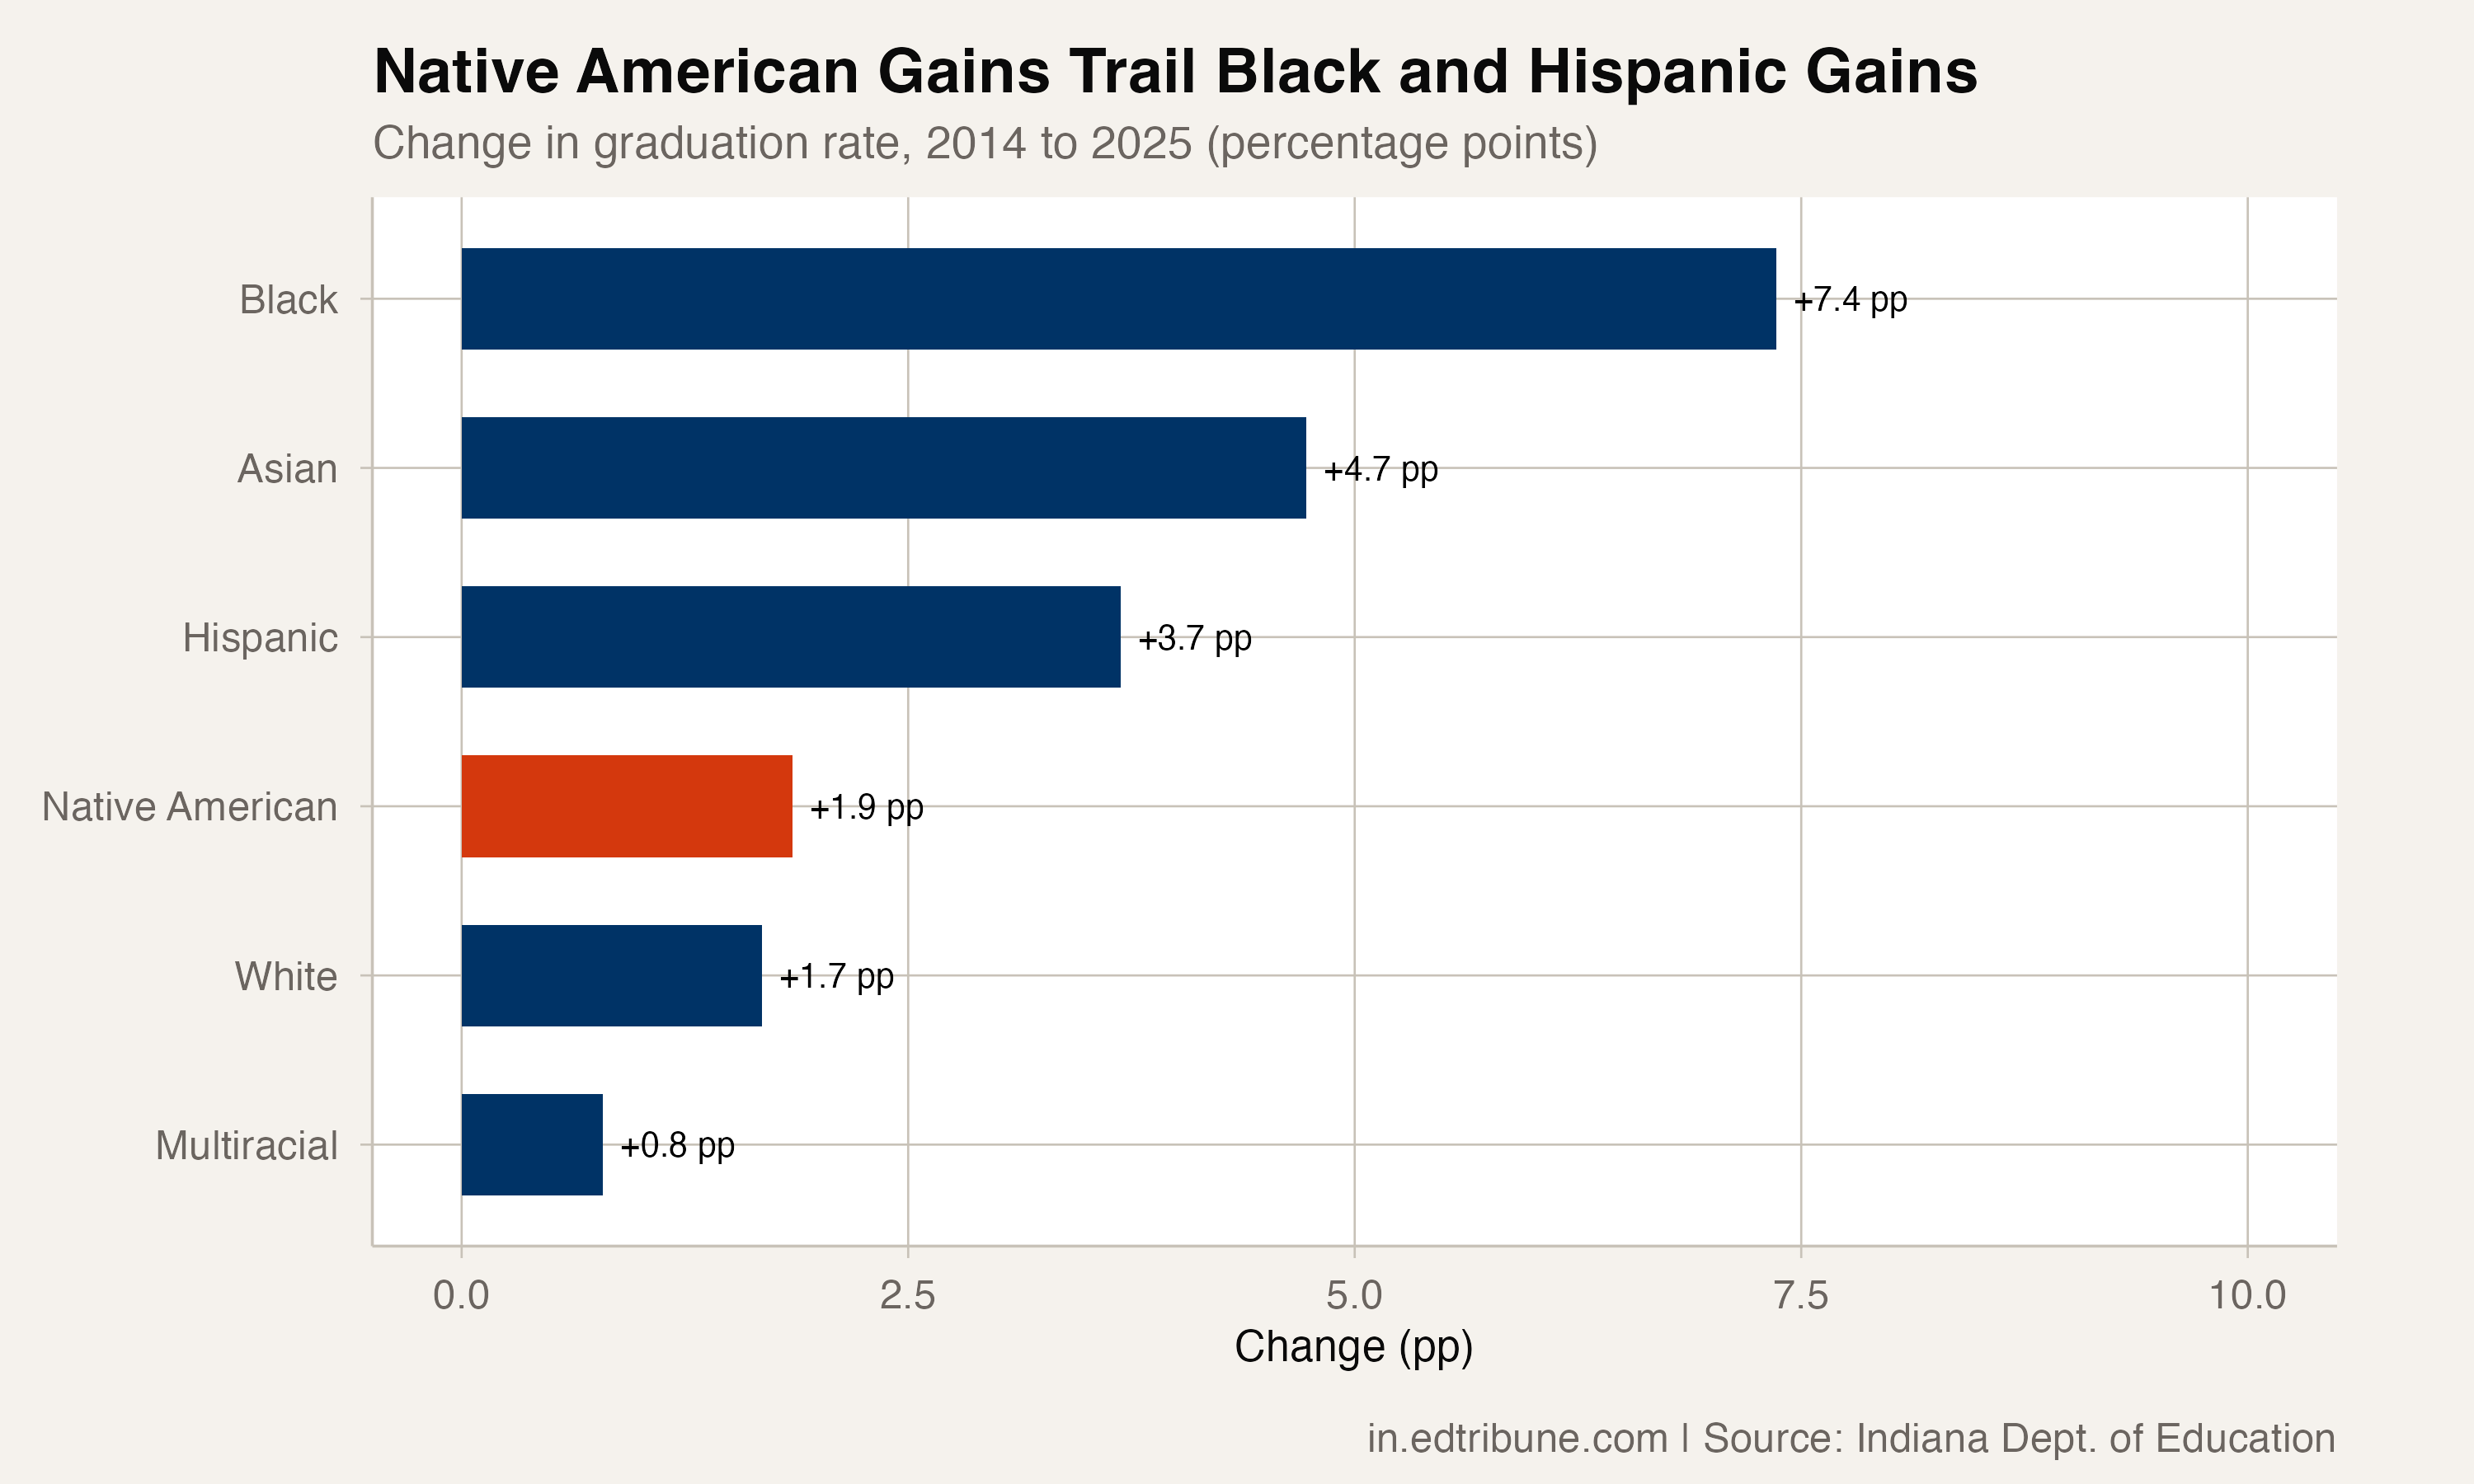
The contrast with Black and Hispanic students is stark. Black students gained 7.4 percentage points, cutting their gap with white students from 12.1 to 6.5 points. Hispanic students gained 3.7 points, narrowing their white-student gap from 5.6 points to 3.6.
Native American students' 1.9-point improvement between 2014 and 2025 left the gap almost exactly where it started.
Volatile data, stagnant trend
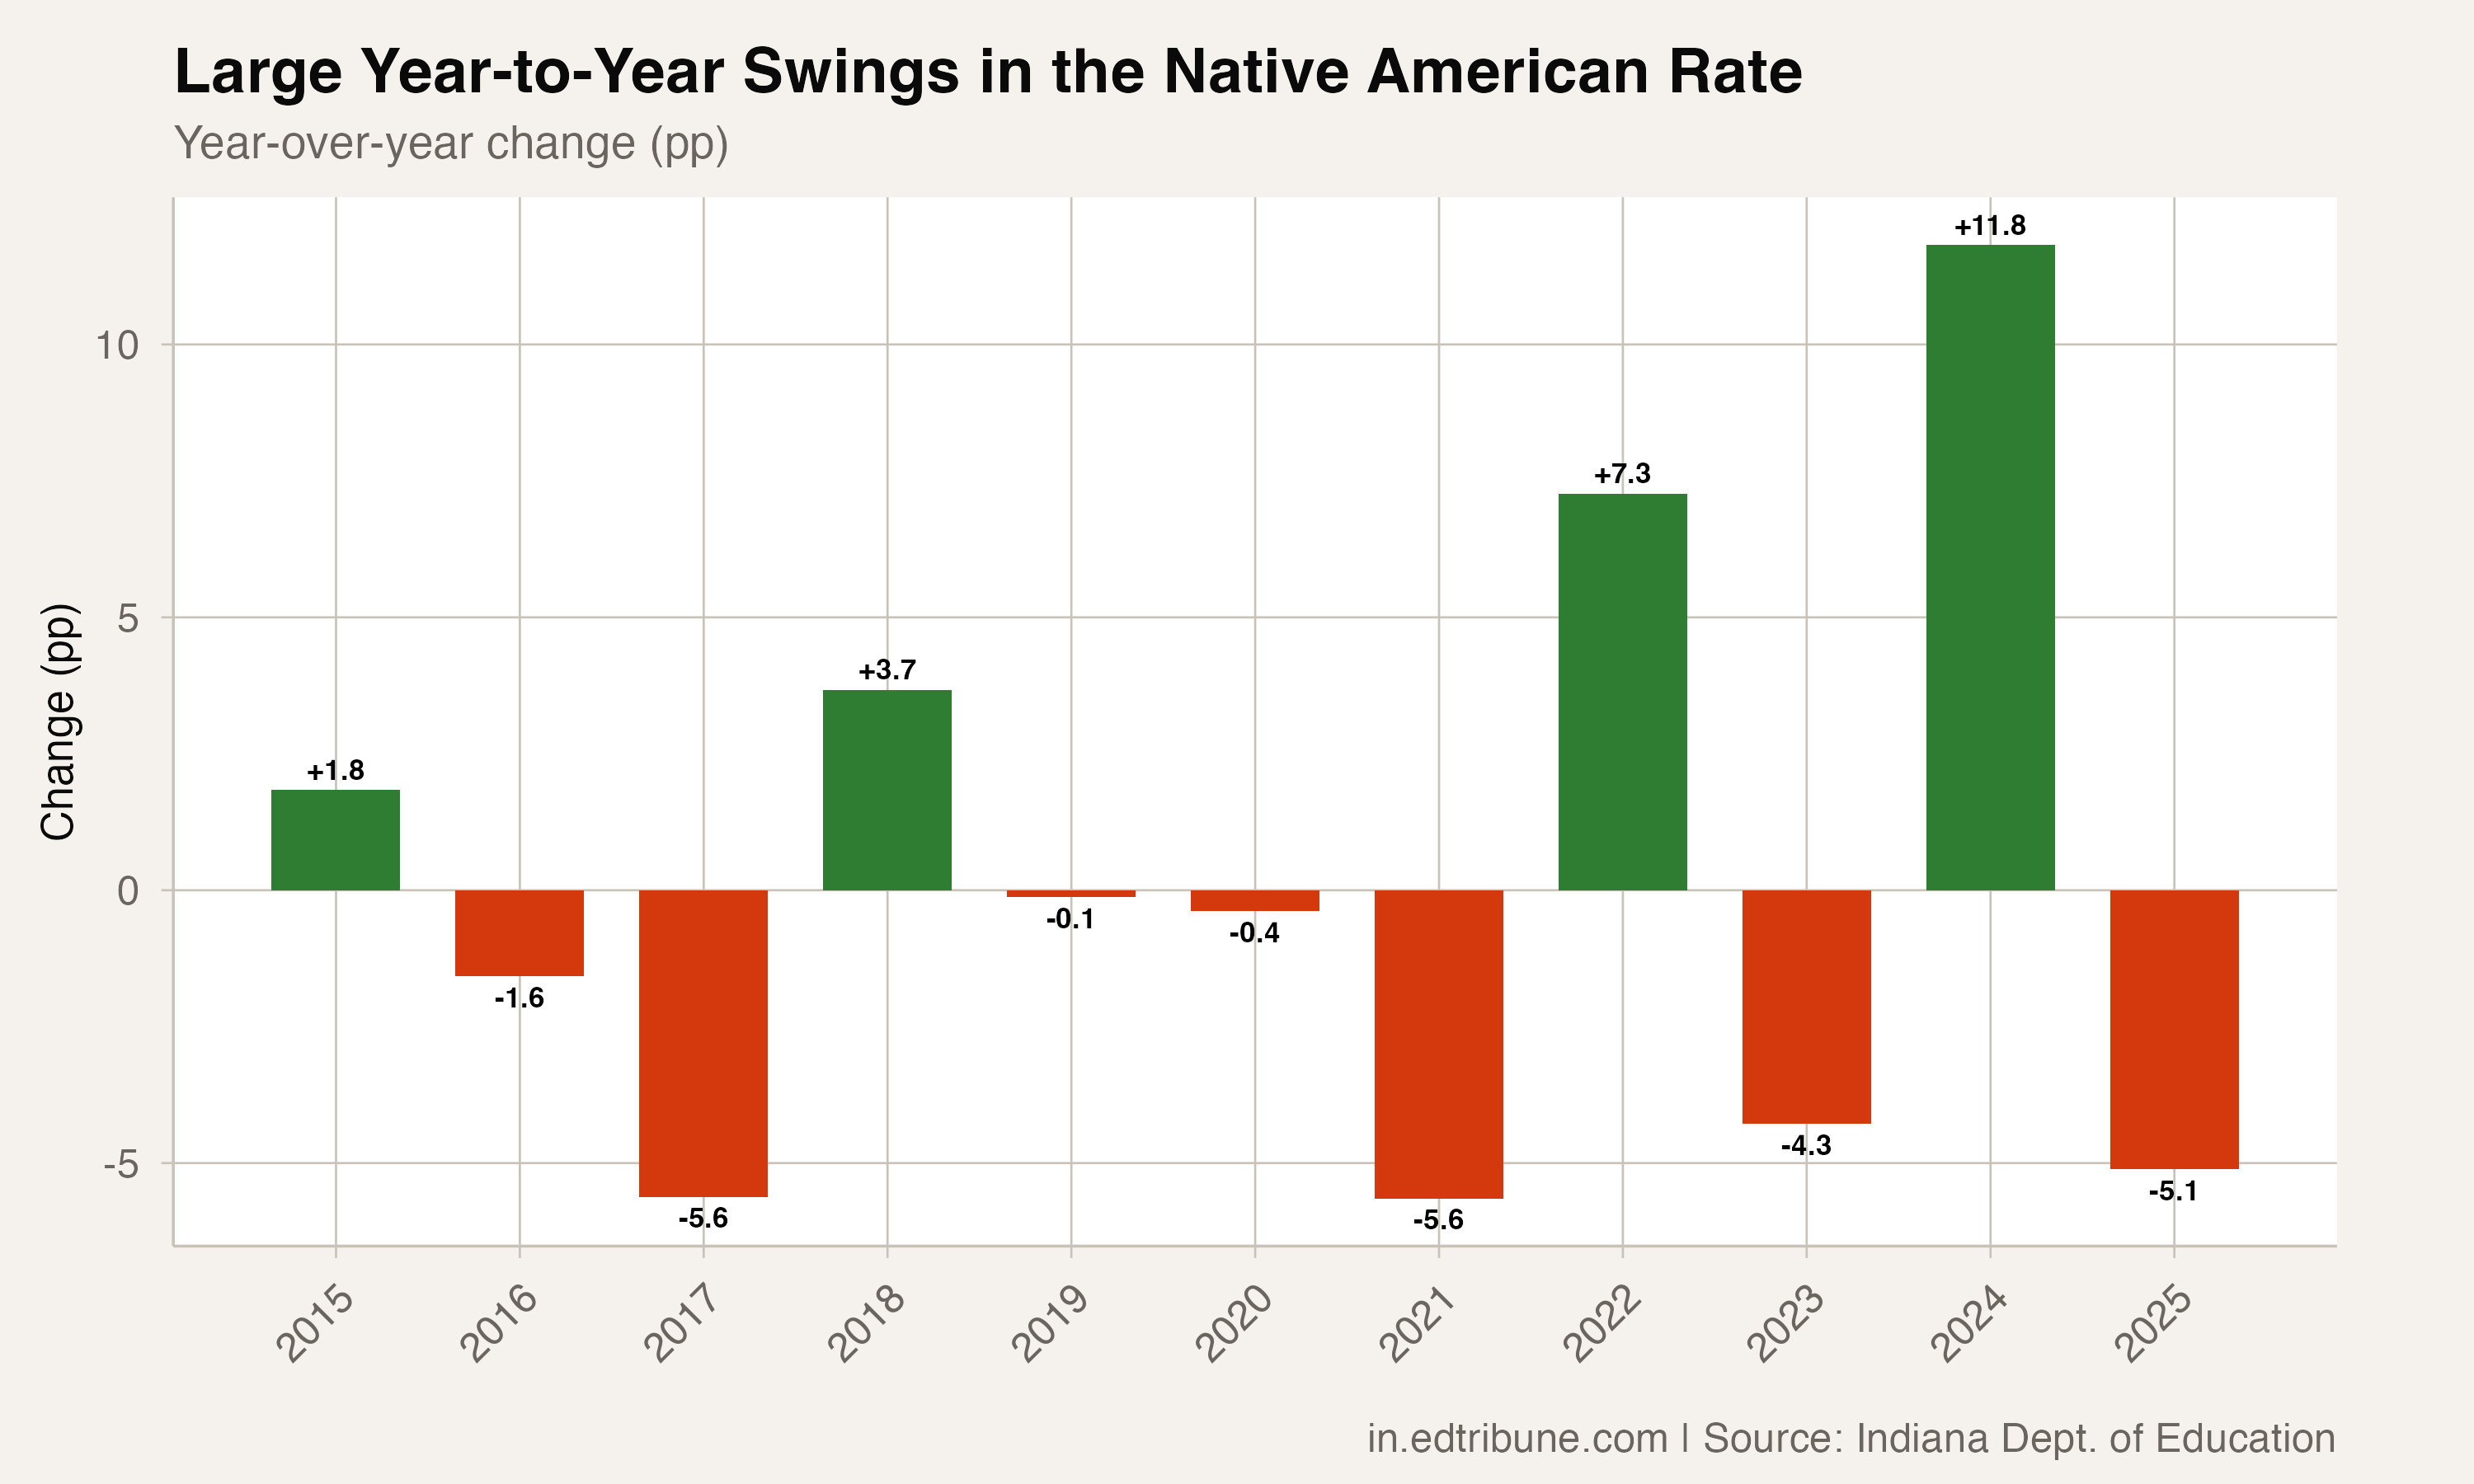
The year-to-year data for Native American students is noisy. The rate climbed from 77.0% in 2021 to 91.8% in 2024 — a 14.8-point jump — then fell back to 86.7% by 2025.
The Native American statewide cohort contained 174 students in 2021, 159 in 2024 and 143 in 2025. With cohorts this small, a few additional outcomes can move the rate more than they would in a much larger group. The package's latest file contains 358 corporation-level Native American rows and no unsuppressed rates.
The volatility makes it difficult to draw conclusions from any single year. The Native American rate was 84.9% in 2014.
The Native American rate was 86.7% in 2025, a 1.9-point endpoint gain.
A small population, a persistent gap
Indiana's Native American graduation cohort is small, and corporation-level rates are suppressed throughout the package's 2025 file. The state series can describe the statewide result, but the suppressed local cells cannot show which corporations improved or declined.
The 6.6-point gap with white students was not the state's largest racial gap in either endpoint year. It did, however, change little: a 0.2-point narrowing from 2014. That pattern was not unique.
The white-multiracial gap was 4.0 points in 2014.
The white-multiracial gap widened to 4.9 points in 2025.
Detailed code that reproduces the analysis and figures in this article is available exclusively to EdTribune subscribers.
Discussion
Sign in to join the discussion.
Loading comments...