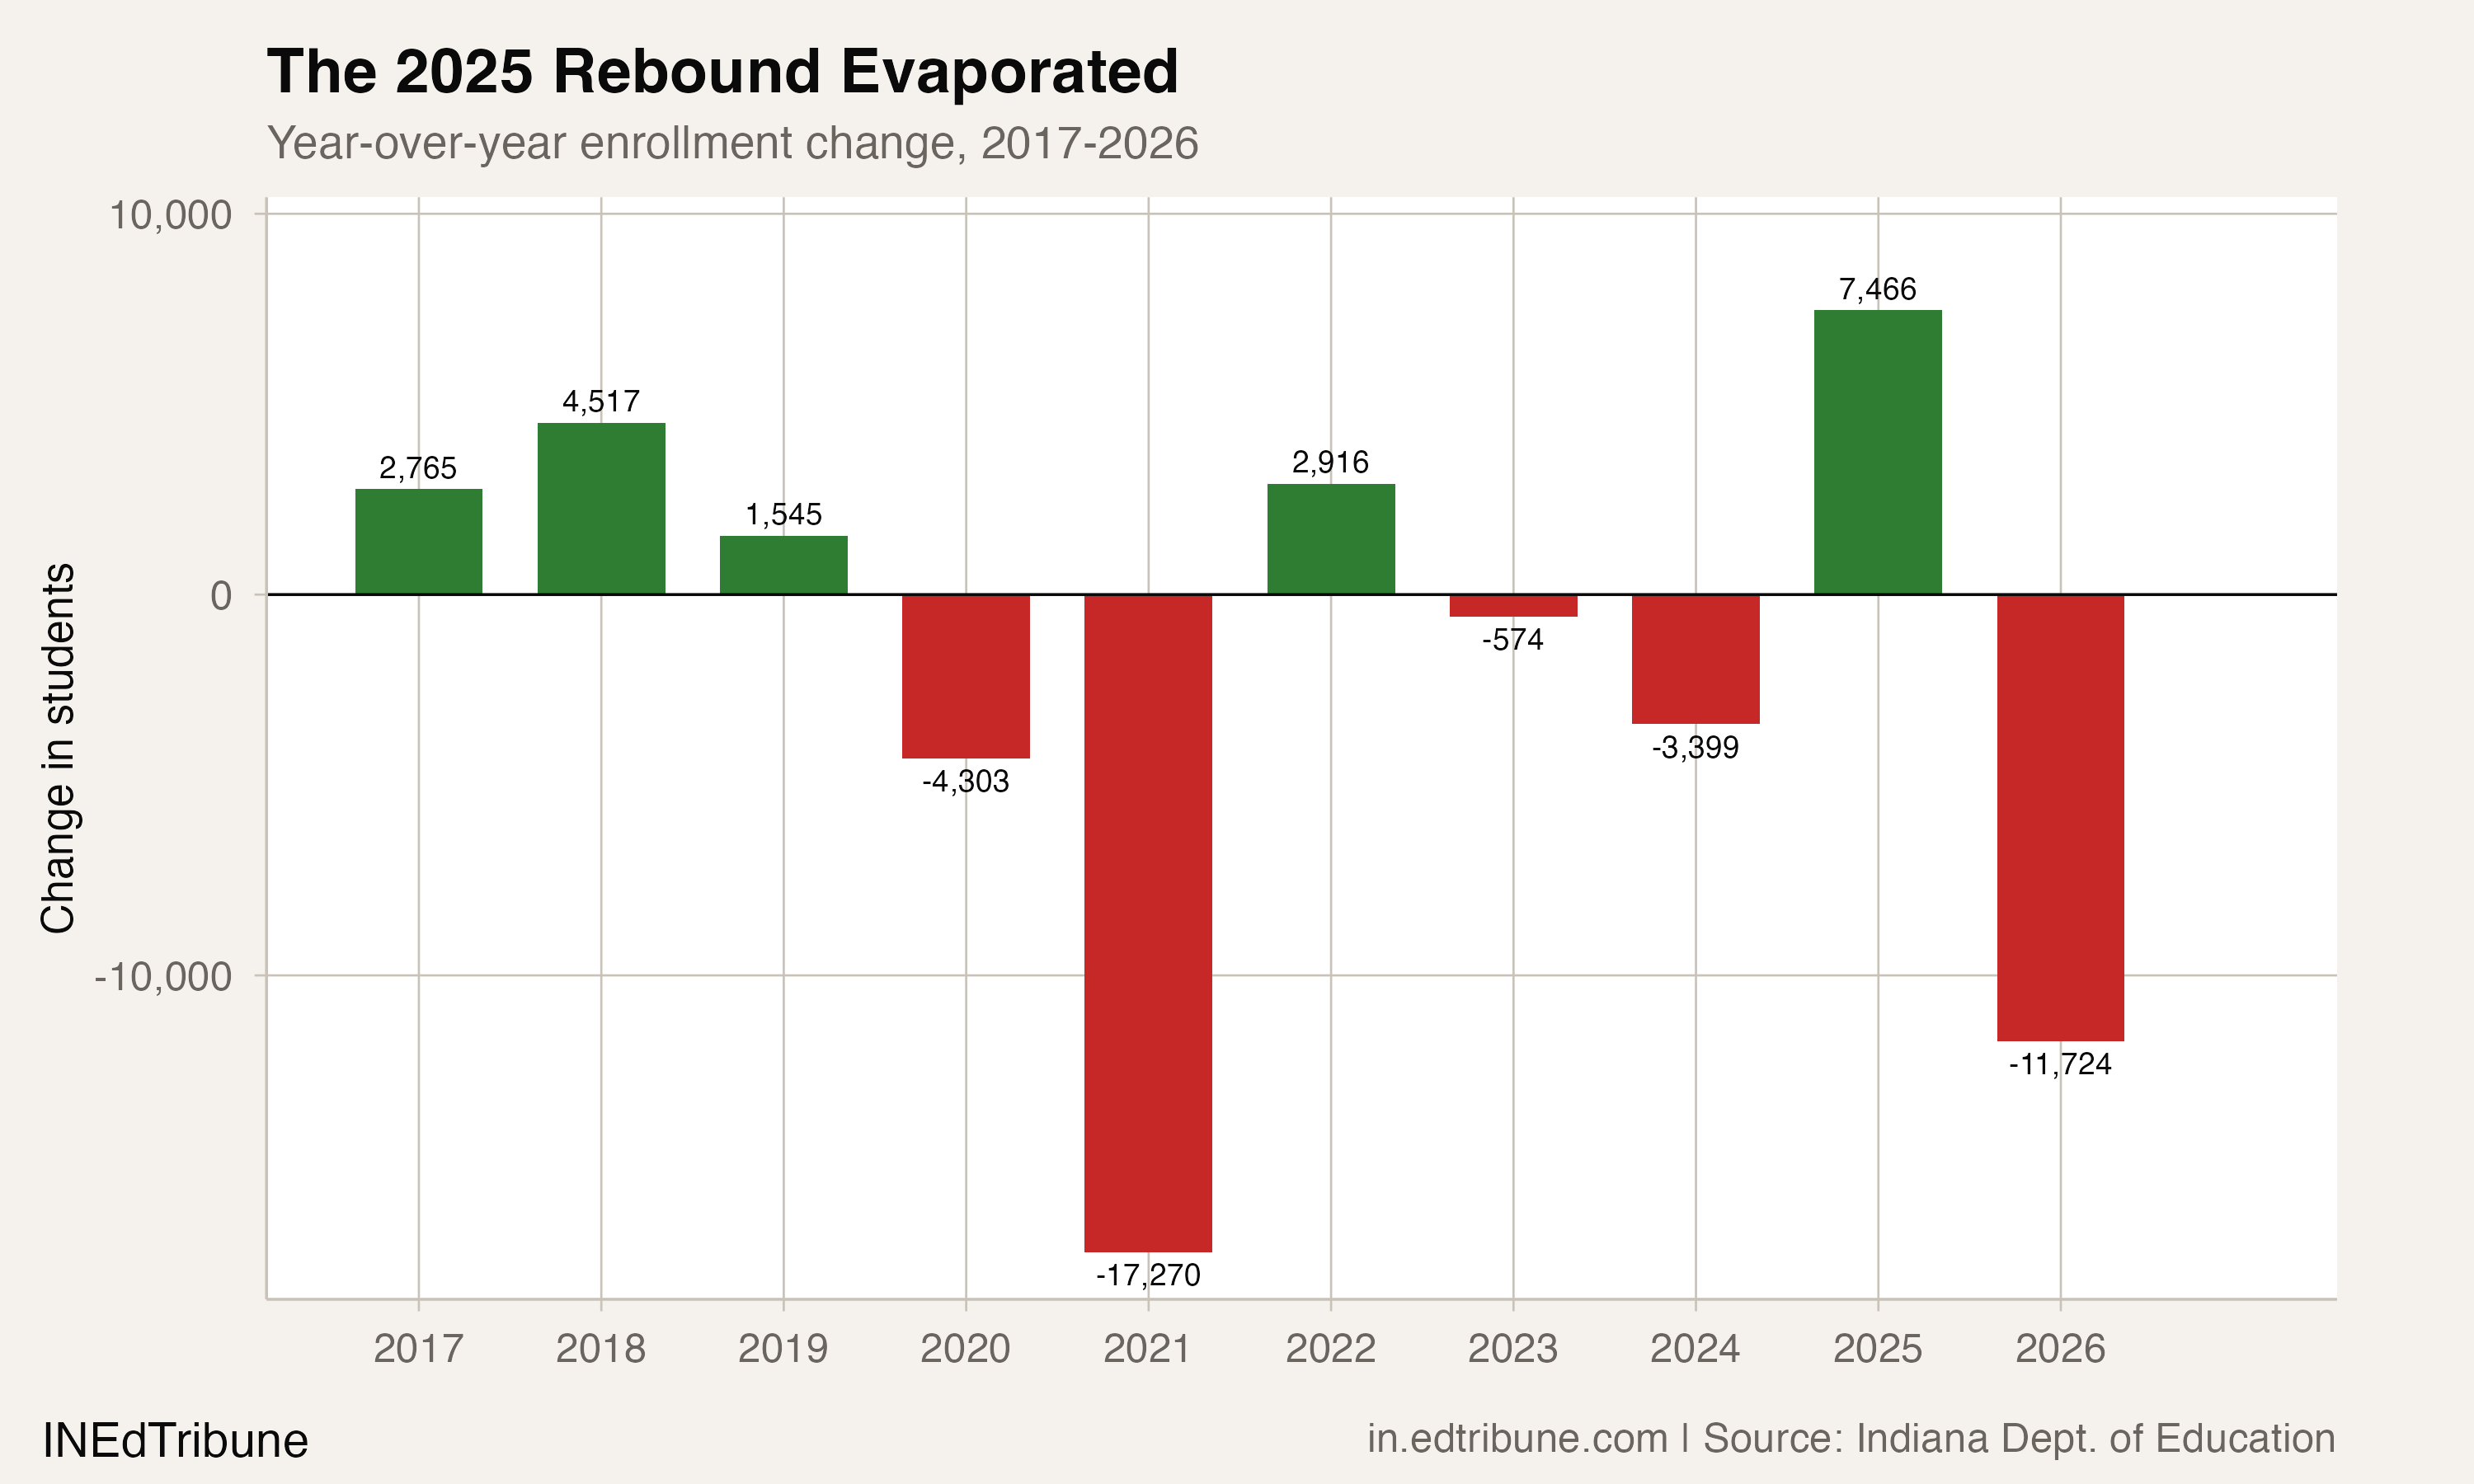
Last year, Indiana's public schools added 7,466 students, the largest single-year gain since before the pandemic. Superintendents cautiously celebrated. State data suggested the long post-COVID slide might be over.
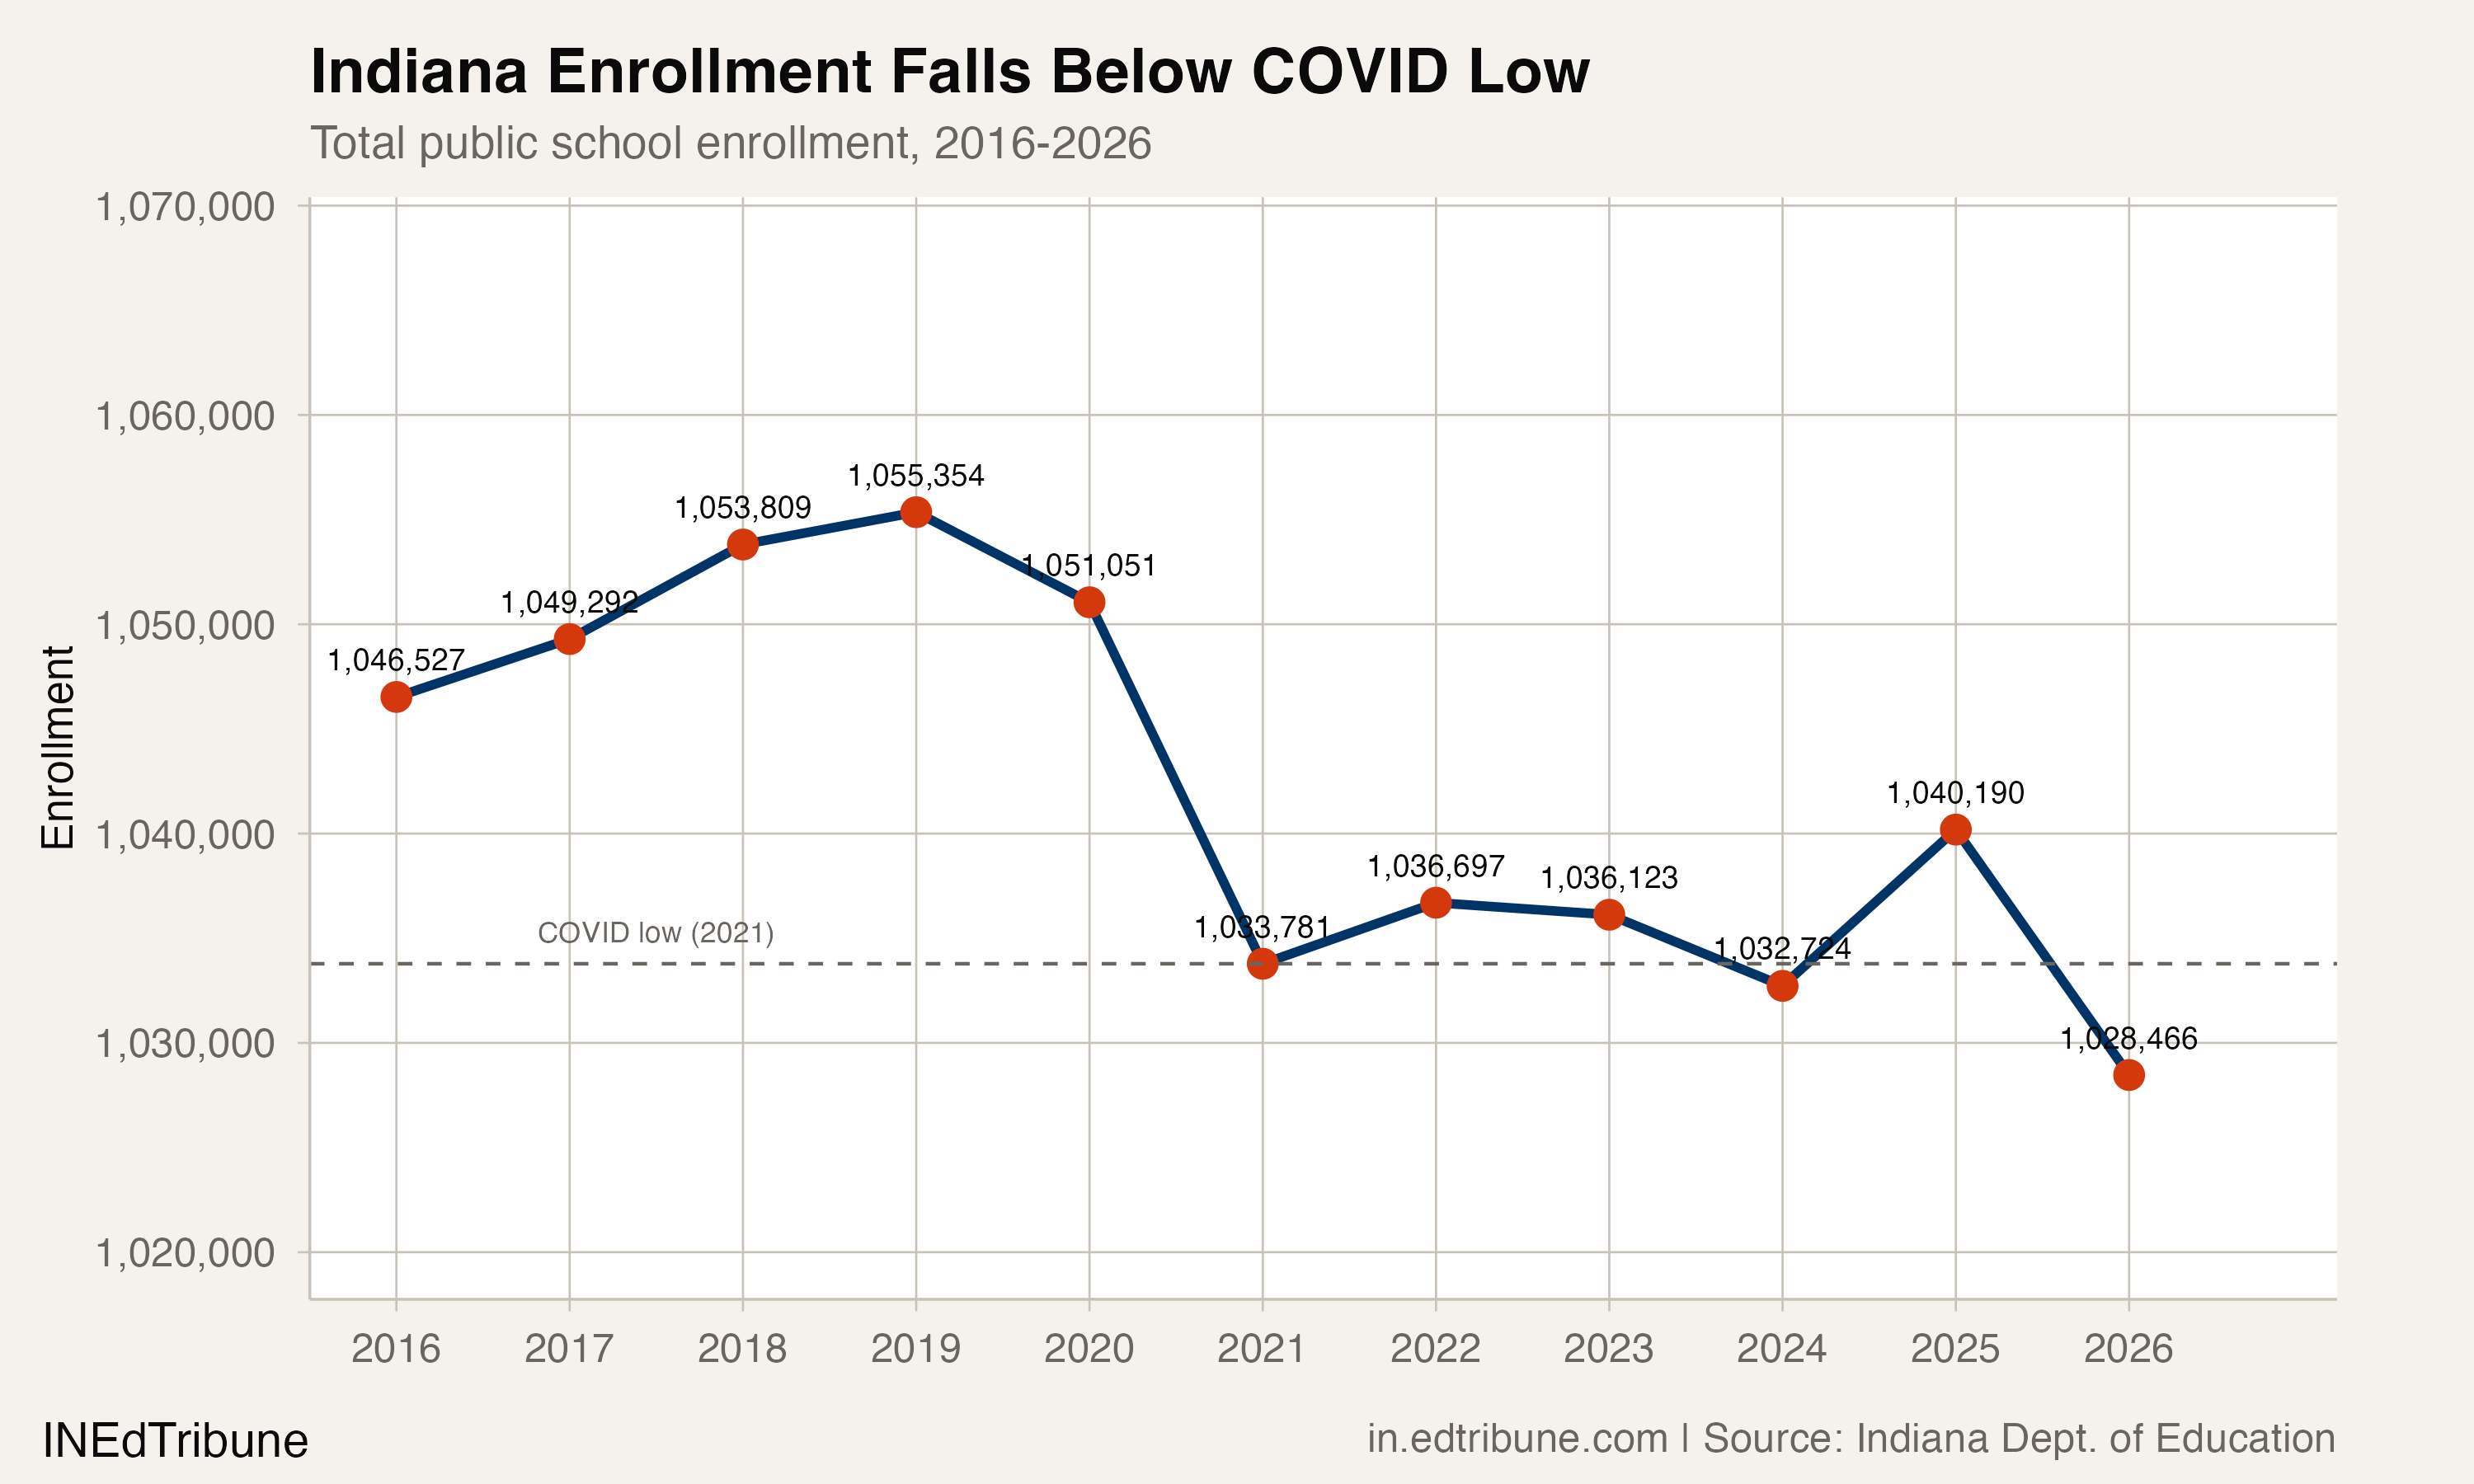
It was not. Indiana lost 11,724 students in 2025-26, a 1.1% decline that wiped out the entire 2025 rebound and then some. At 1,028,466, statewide enrollment has fallen to its lowest point in the 11-year window of comparable data, dropping 5,315 students below the pandemic-era floor set in 2020-21. Two out of three school corporations lost students. The state is not recovering from COVID. It is falling further behind.
A decade of erosion
Indiana's enrollment peaked at 1,055,354 in 2018-19. The 26,888-student gap between that peak and today is equivalent to losing a district the size of Fort Wayne Community Schools, the state's largest corporation. The trajectory has been almost uniformly downward: only two years in the past seven have posted gains, and the larger of those, the 2025 rebound, has now been fully reversed.
The year-over-year pattern reveals just how unusual the 2025 gain was. Sandwiched between a loss of 3,399 in 2024 and 11,724 in 2026, the +7,466 looks less like a turning point and more like a reporting anomaly. Of the 122 corporations that gained students in 2025, more than half gave them back in 2026, accounting for 8,815 of the statewide loss.
Several of the largest 2025 gains came from corporations whose enrollment histories suggest boundary changes or virtual school consolidations rather than organic growth. Clarksville Community School Corporation, for instance, jumped from 1,383 students in 2016 to 7,174 in 2025, a pattern consistent with absorbing new programs rather than attracting families. Union School Corporation followed the opposite trajectory: it grew from 238 students to 7,853 in nine years, then dropped 1,455 in a single year, the largest absolute loss of any corporation in the state.
The losses were everywhere
The 2026 decline was broad-based. Of 424 corporations reporting in both years, 281 lost students, 66% of the total. The 10 biggest losers accounted for 7,343 students, roughly 63% of the statewide decline.
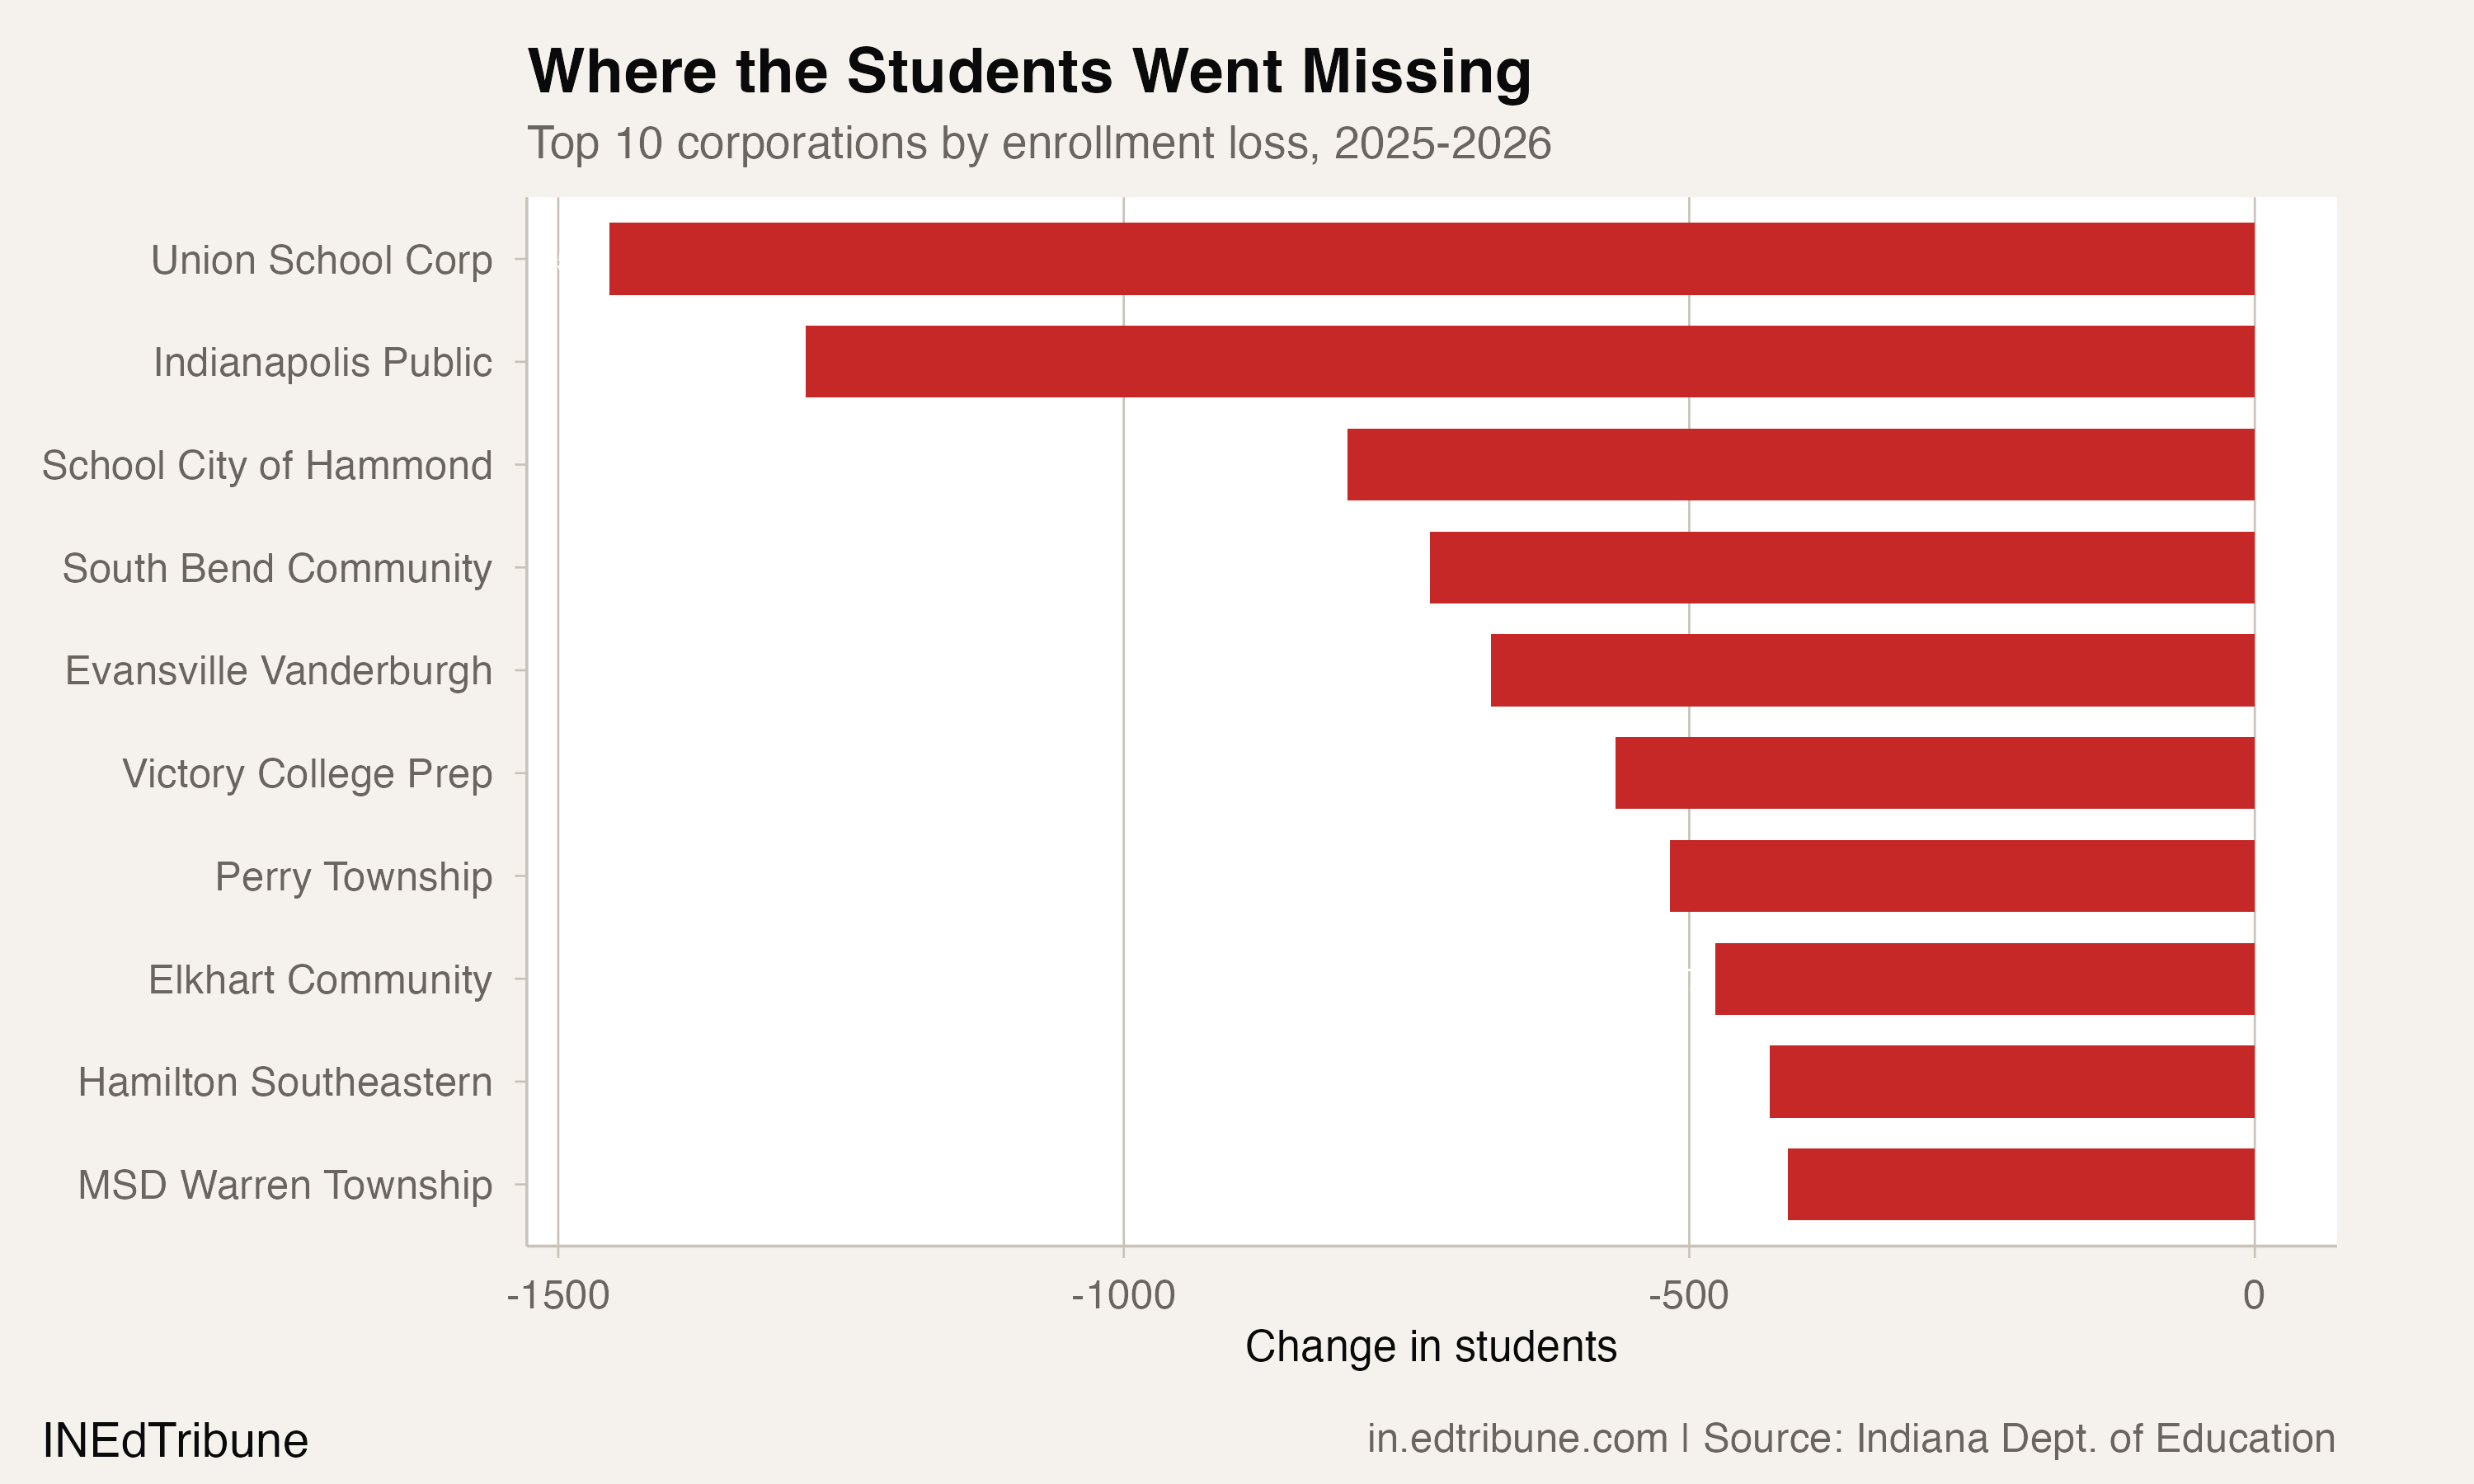
Indianapolis Public Schools↗ lost 1,281 students, a 6.1% drop that brought enrollment to 19,774, its lowest point in the available data. IPS has lost 9,809 students since 2016, a 33.2% decline over a decade. The loss was not concentrated in one division: Chalkbeat Indiana reported that high schools fell 9%, with ninth grade alone losing roughly 20% of its students. Indianapolis charter schools also declined, shedding 627 students across approximately 60 schools. The traditional-vs.-charter framing does not explain what is happening in Marion County; both sectors are shrinking.
South Bend Community School Corp↗ lost 729 students (5.4%). Evansville Vanderburgh School Corp↗ lost 675 (3.1%). School City of Hammond lost 802 (7.6%). The urban core of the state is losing students faster than the suburbs can absorb them, and the suburbs are no longer absorbing much at all. Hamilton Southeastern Schools↗, one of the state's largest suburban corporations, lost 429 students (2.0%).
Fewer children entering, more leaving
The demographic math behind the decline is visible in two converging lines. In 2016, Indiana's kindergarten classes were larger than its senior classes: 77,038 kindergartners versus 74,935 twelfth-graders. By 2018, grade 12 had surpassed kindergarten. The gap has widened every year since.
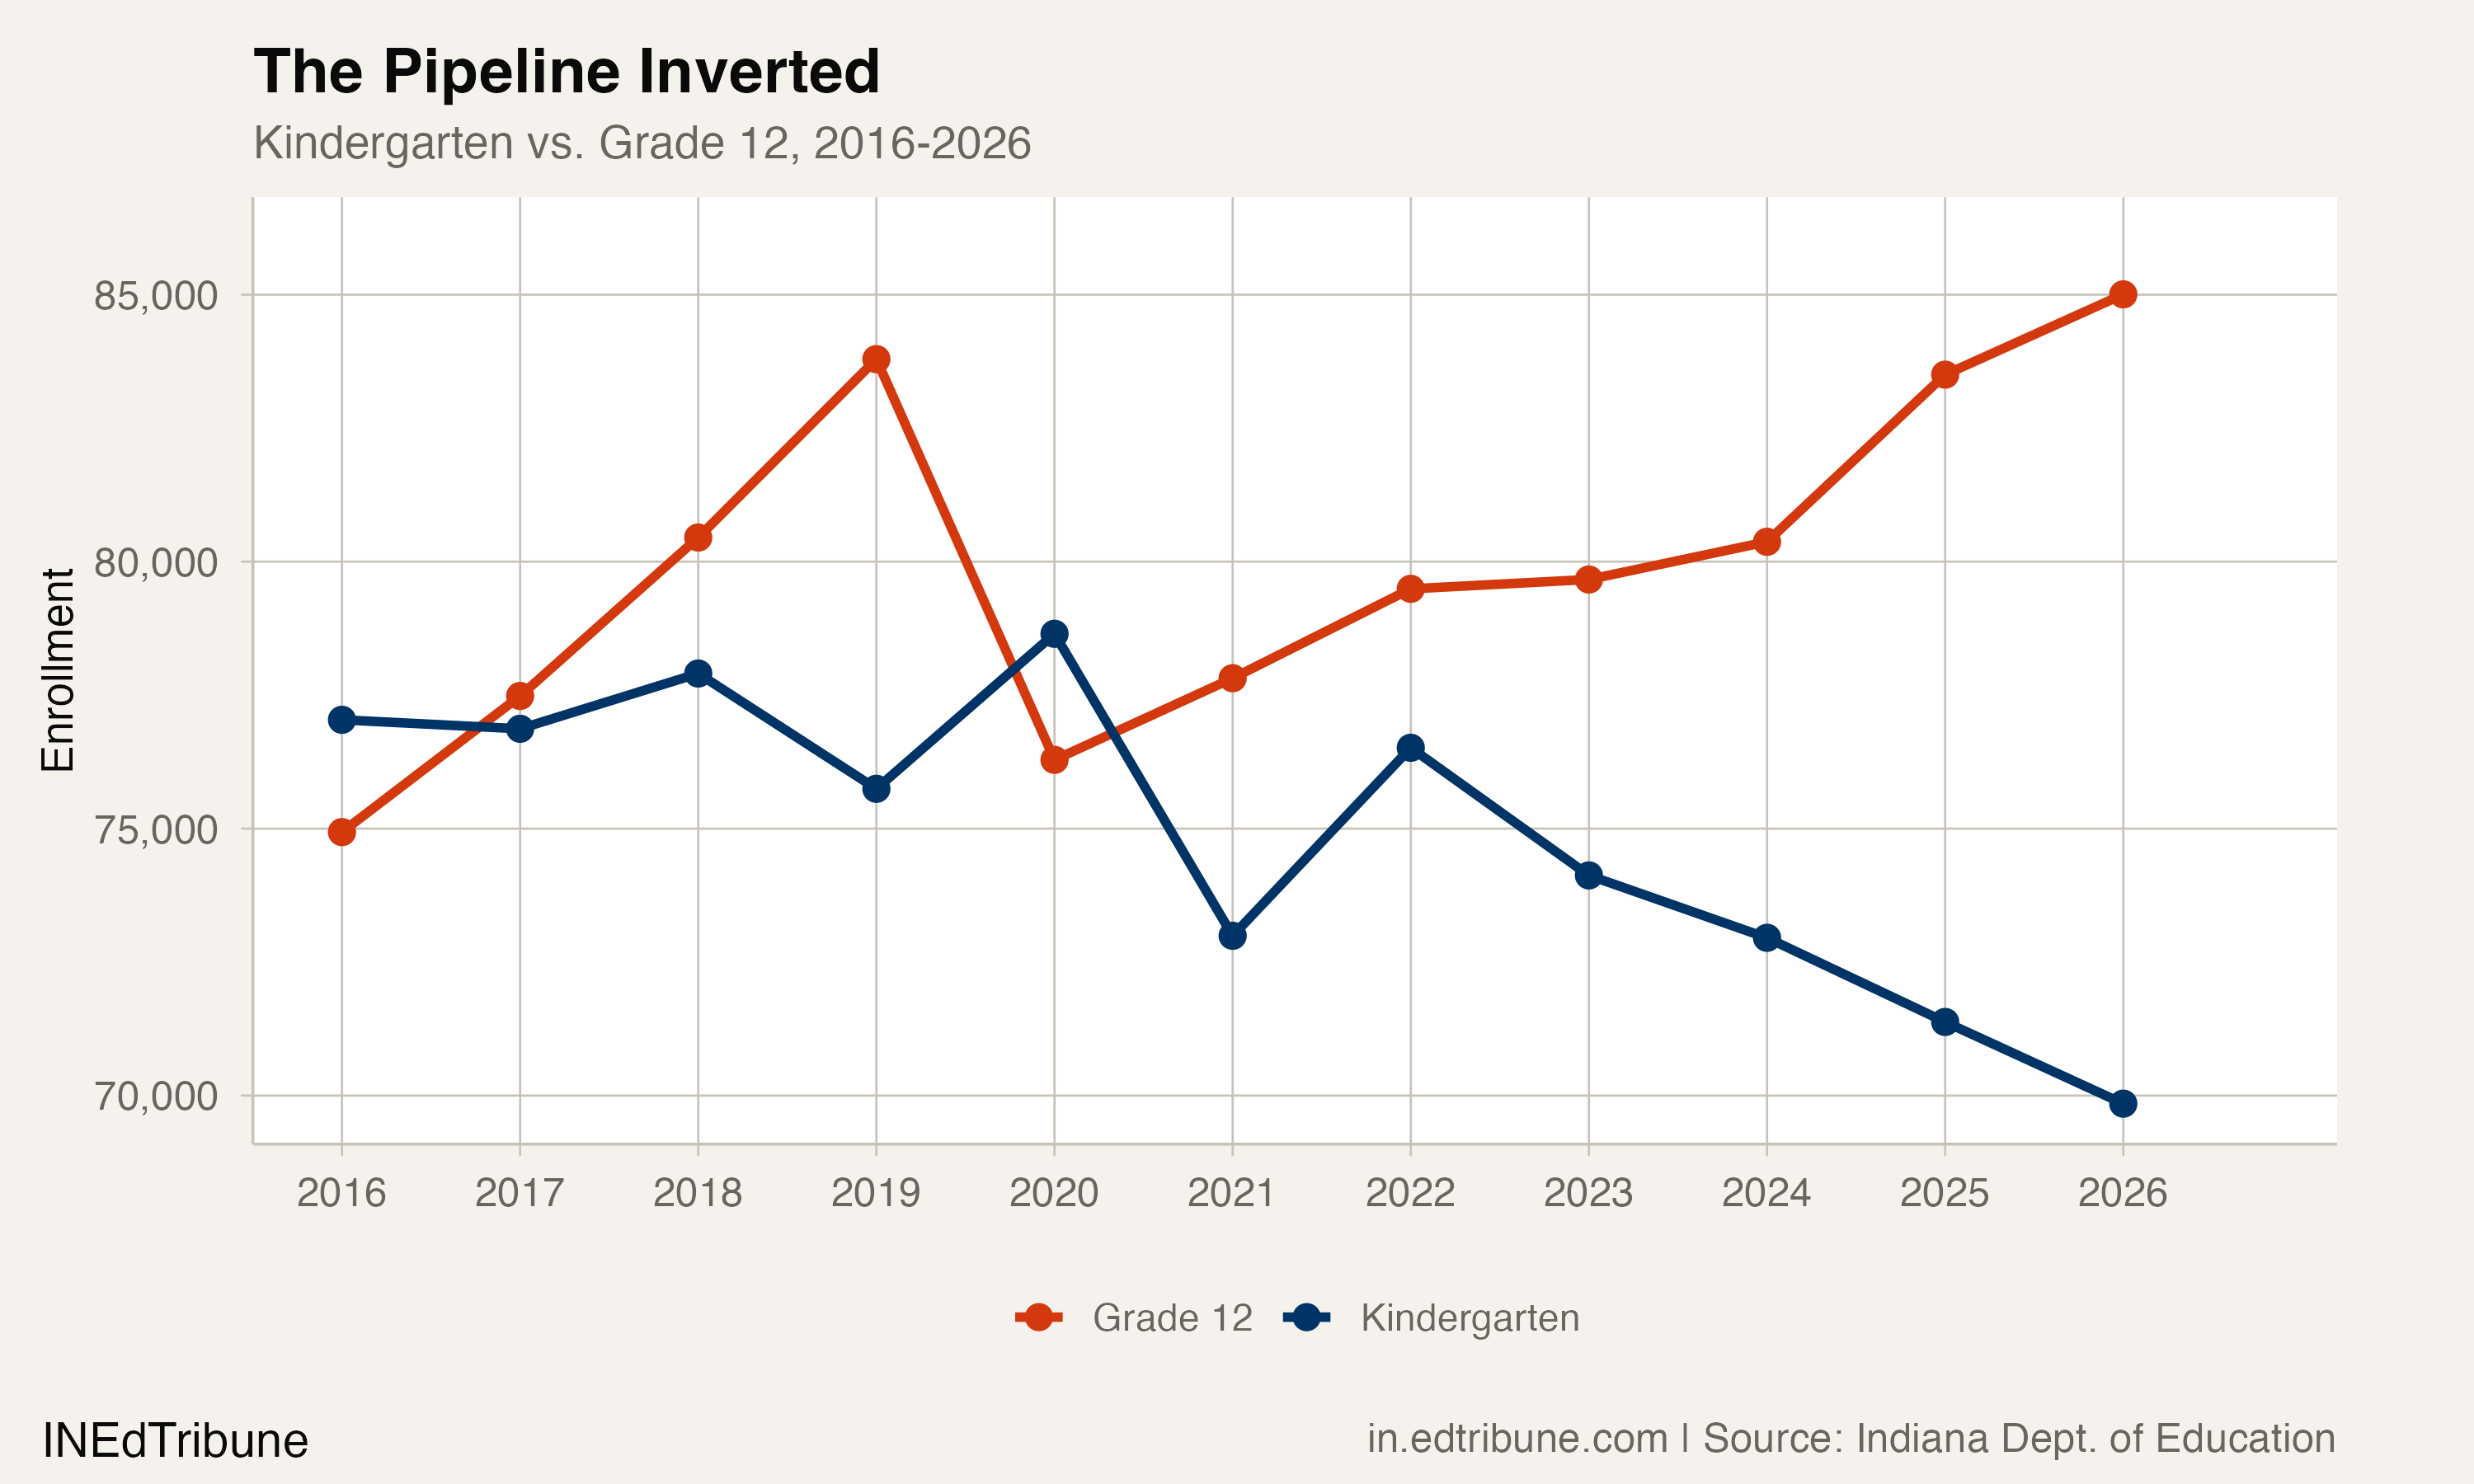
In 2025-26, the state enrolled 85,006 seniors and just 69,849 kindergartners, a difference of 15,157 students. Each year, Indiana graduates a large cohort and replaces it with a smaller one. First grade lost the most students of any single grade this year, dropping 2,938 (4.0%), as the small 2025 kindergarten class rolled upward and an even smaller one took its place. Only two grades grew: sixth (up 1,416) and twelfth (up 1,504).
The kindergarten decline reflects a birth rate that has been falling for nearly two decades. Indiana recorded 80,257 births in 2024, a modest 1.6% uptick driven entirely by births to foreign-born mothers, but still 11% below the 2007 peak of 89,900. The 2024 increase, if sustained, would not reach kindergarten classrooms until 2029 or 2030.
Indiana University's demographic projections estimate the state's school-age population will fall by more than 105,000 by 2060, a 5.9% decline from 2020 levels. Rural counties face the steepest drops, with a projected 16% decline by 2050.
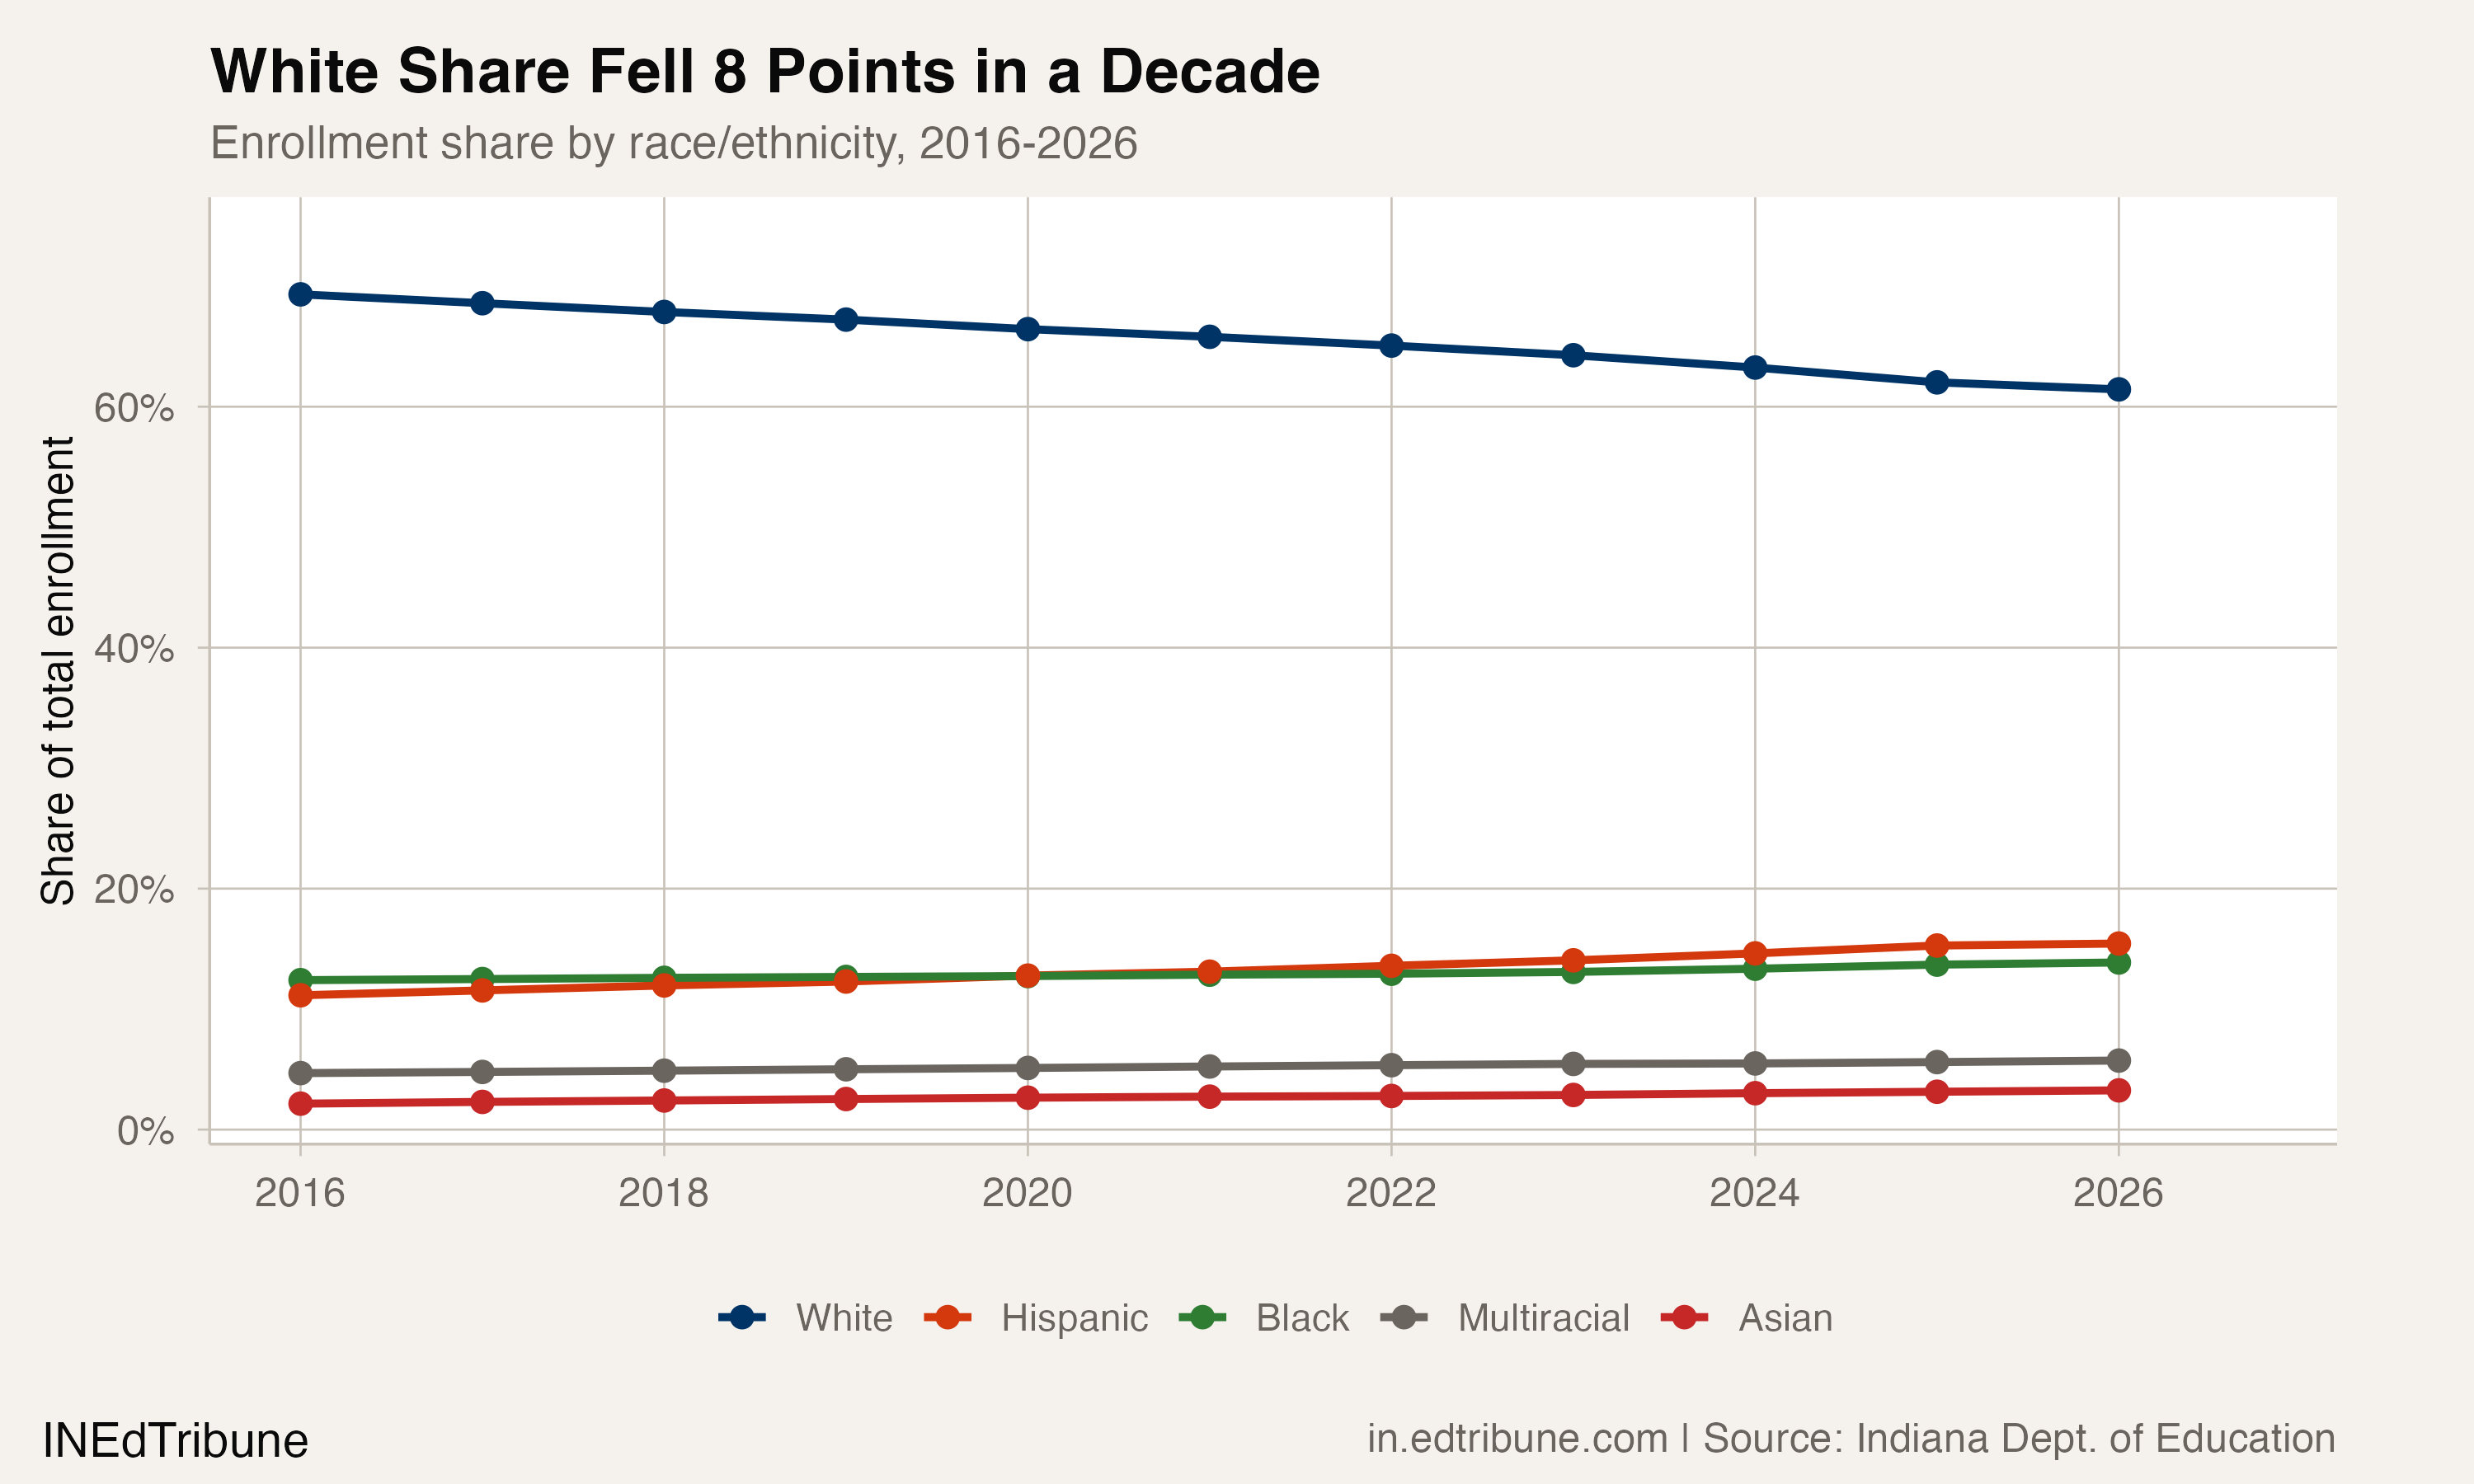
A state growing more diverse as it shrinks
Indiana lost 93,606 white students between 2016 and 2026, a 12.9% decline. Every other racial and ethnic group grew over the same period: Hispanic enrollment rose 36.1% (adding 42,137 students), Black enrollment grew 9.9% (+12,836), Asian enrollment increased 48.7% (+10,964), and multiracial enrollment climbed 20.1% (+9,861). White students' share of total enrollment fell from 69.3% to 61.4%.
The growth in non-white enrollment has not been large enough to offset white losses. The combined gain from Hispanic, Black, Asian, and multiracial students since 2016 was 75,798, covering only 81% of the 93,606 white students who left. The remaining gap, plus a small net decline in Native American enrollment, accounts for the statewide shrinkage.
One signal in the 2026 data stands out: Hispanic enrollment declined by 102 students, the first year-over-year drop in the entire 2016-2026 window. The dip is small enough to be statistical noise. But it arrives as immigration enforcement concerns are affecting enrollment counts nationally, and as Indiana's own birth data shows that the recent increase in births was driven exclusively by foreign-born mothers. Whether the Hispanic enrollment plateau reflects fewer arrivals, families avoiding registration, or normal fluctuation cannot be determined from one year of data.
133 corporations at their lowest point
The record books tilt heavily toward decline. Of corporations with at least six years of data, 133 sit at their all-time low enrollment in 2025-26, while just 62 are at a record high. The ratio is worse than 2:1. Among the 26 corporations that have declined every year from 2022 through 2026, many are small rural districts where each lost student represents a measurable share of the operating budget.
A 2024 IU Center for Evaluation and Education Policy report found that 91 of 167 corporations with fewer than 1,000 students experienced enrollment declines, raising what the researchers called "sustainability concerns, potential funding inequities, and future consolidation risks."
The funding formula's cruel arithmetic
The 2026 loss is not a one-time correction. It follows a structural pattern: fewer children are being born in Indiana, and the large graduating classes of the late-2010s baby boom are cycling out of schools faster than smaller incoming cohorts can replace them. The pipeline chart does not bend back upward under any plausible scenario for the next five years.
Indiana's universal voucher expansion, set to take effect in June 2026, will add pressure from a different direction. The existing Choice Scholarship program cost approximately $439 million in 2023-24. When income eligibility caps are removed, every departure from a public school will carry roughly $8,800 in per-pupil funding with it. A district that loses 200 students loses $1.76 million. A district that loses 1,281, as IPS just did, loses $11.3 million.
That arithmetic is already reshaping operations. The state's October enrollment count determines the following year's tuition support allocation, meaning that every fall, superintendents across Indiana are counting heads with the knowledge that each empty seat is a line item that disappears from next year's budget.
Detailed code that reproduces the analysis and figures in this article is available exclusively to EdTribune subscribers.
Discussion
Sign in to join the discussion.
Loading comments...