The standard narrative goes like this: school attendance was fine before COVID, COVID broke it, and now we are trying to fix it. Indiana's data complicates that story.
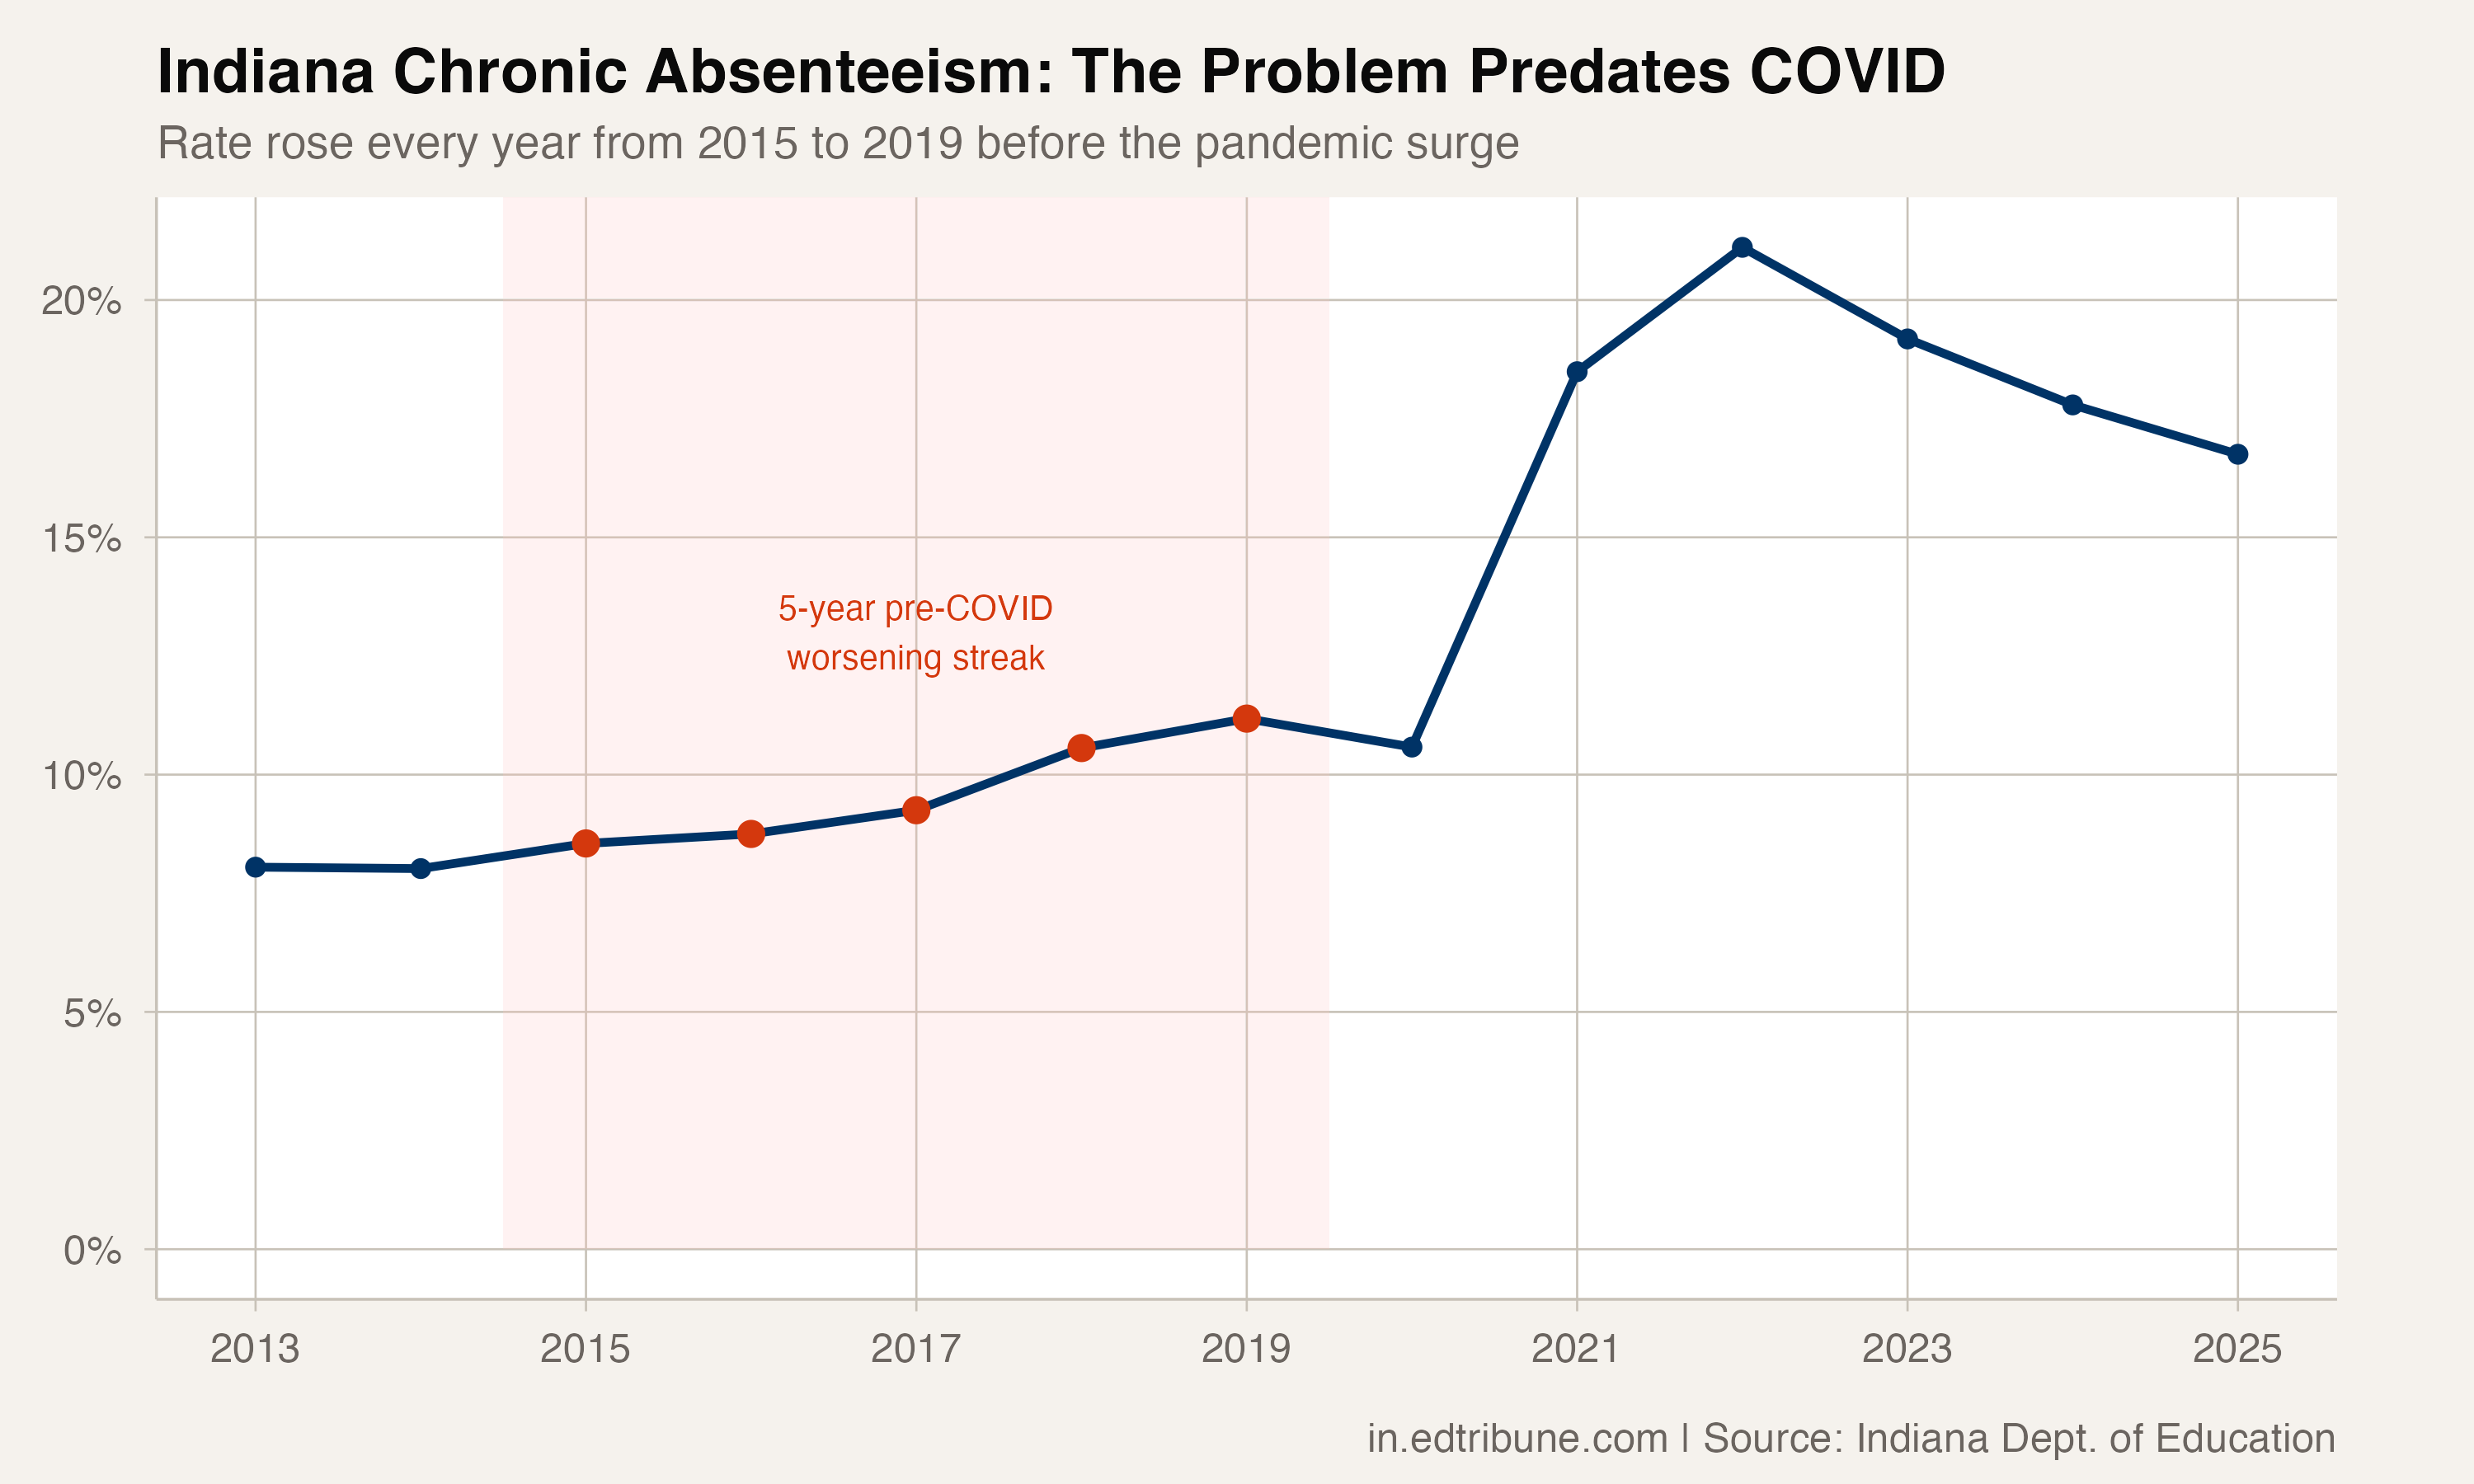
In 2013, Indiana's chronic absenteeism rate was 8.05%. By 2019, before anyone had heard of COVID-19, it had risen to 11.18%, a 3.13 percentage-point increase. The rate went up every single year from 2015 to 2019, five consecutive years of worsening, and crossed 10% for the first time in 2018 at 10.56%.
The pre-COVID baseline was not a baseline
When policymakers and researchers talk about "returning to pre-COVID levels," they implicitly treat the 2019 rate as a target. But Indiana's 2019 rate of 11.18% was itself historically elevated and getting worse. Returning to 11.18% would mean returning to a number that was already moving in the wrong direction.
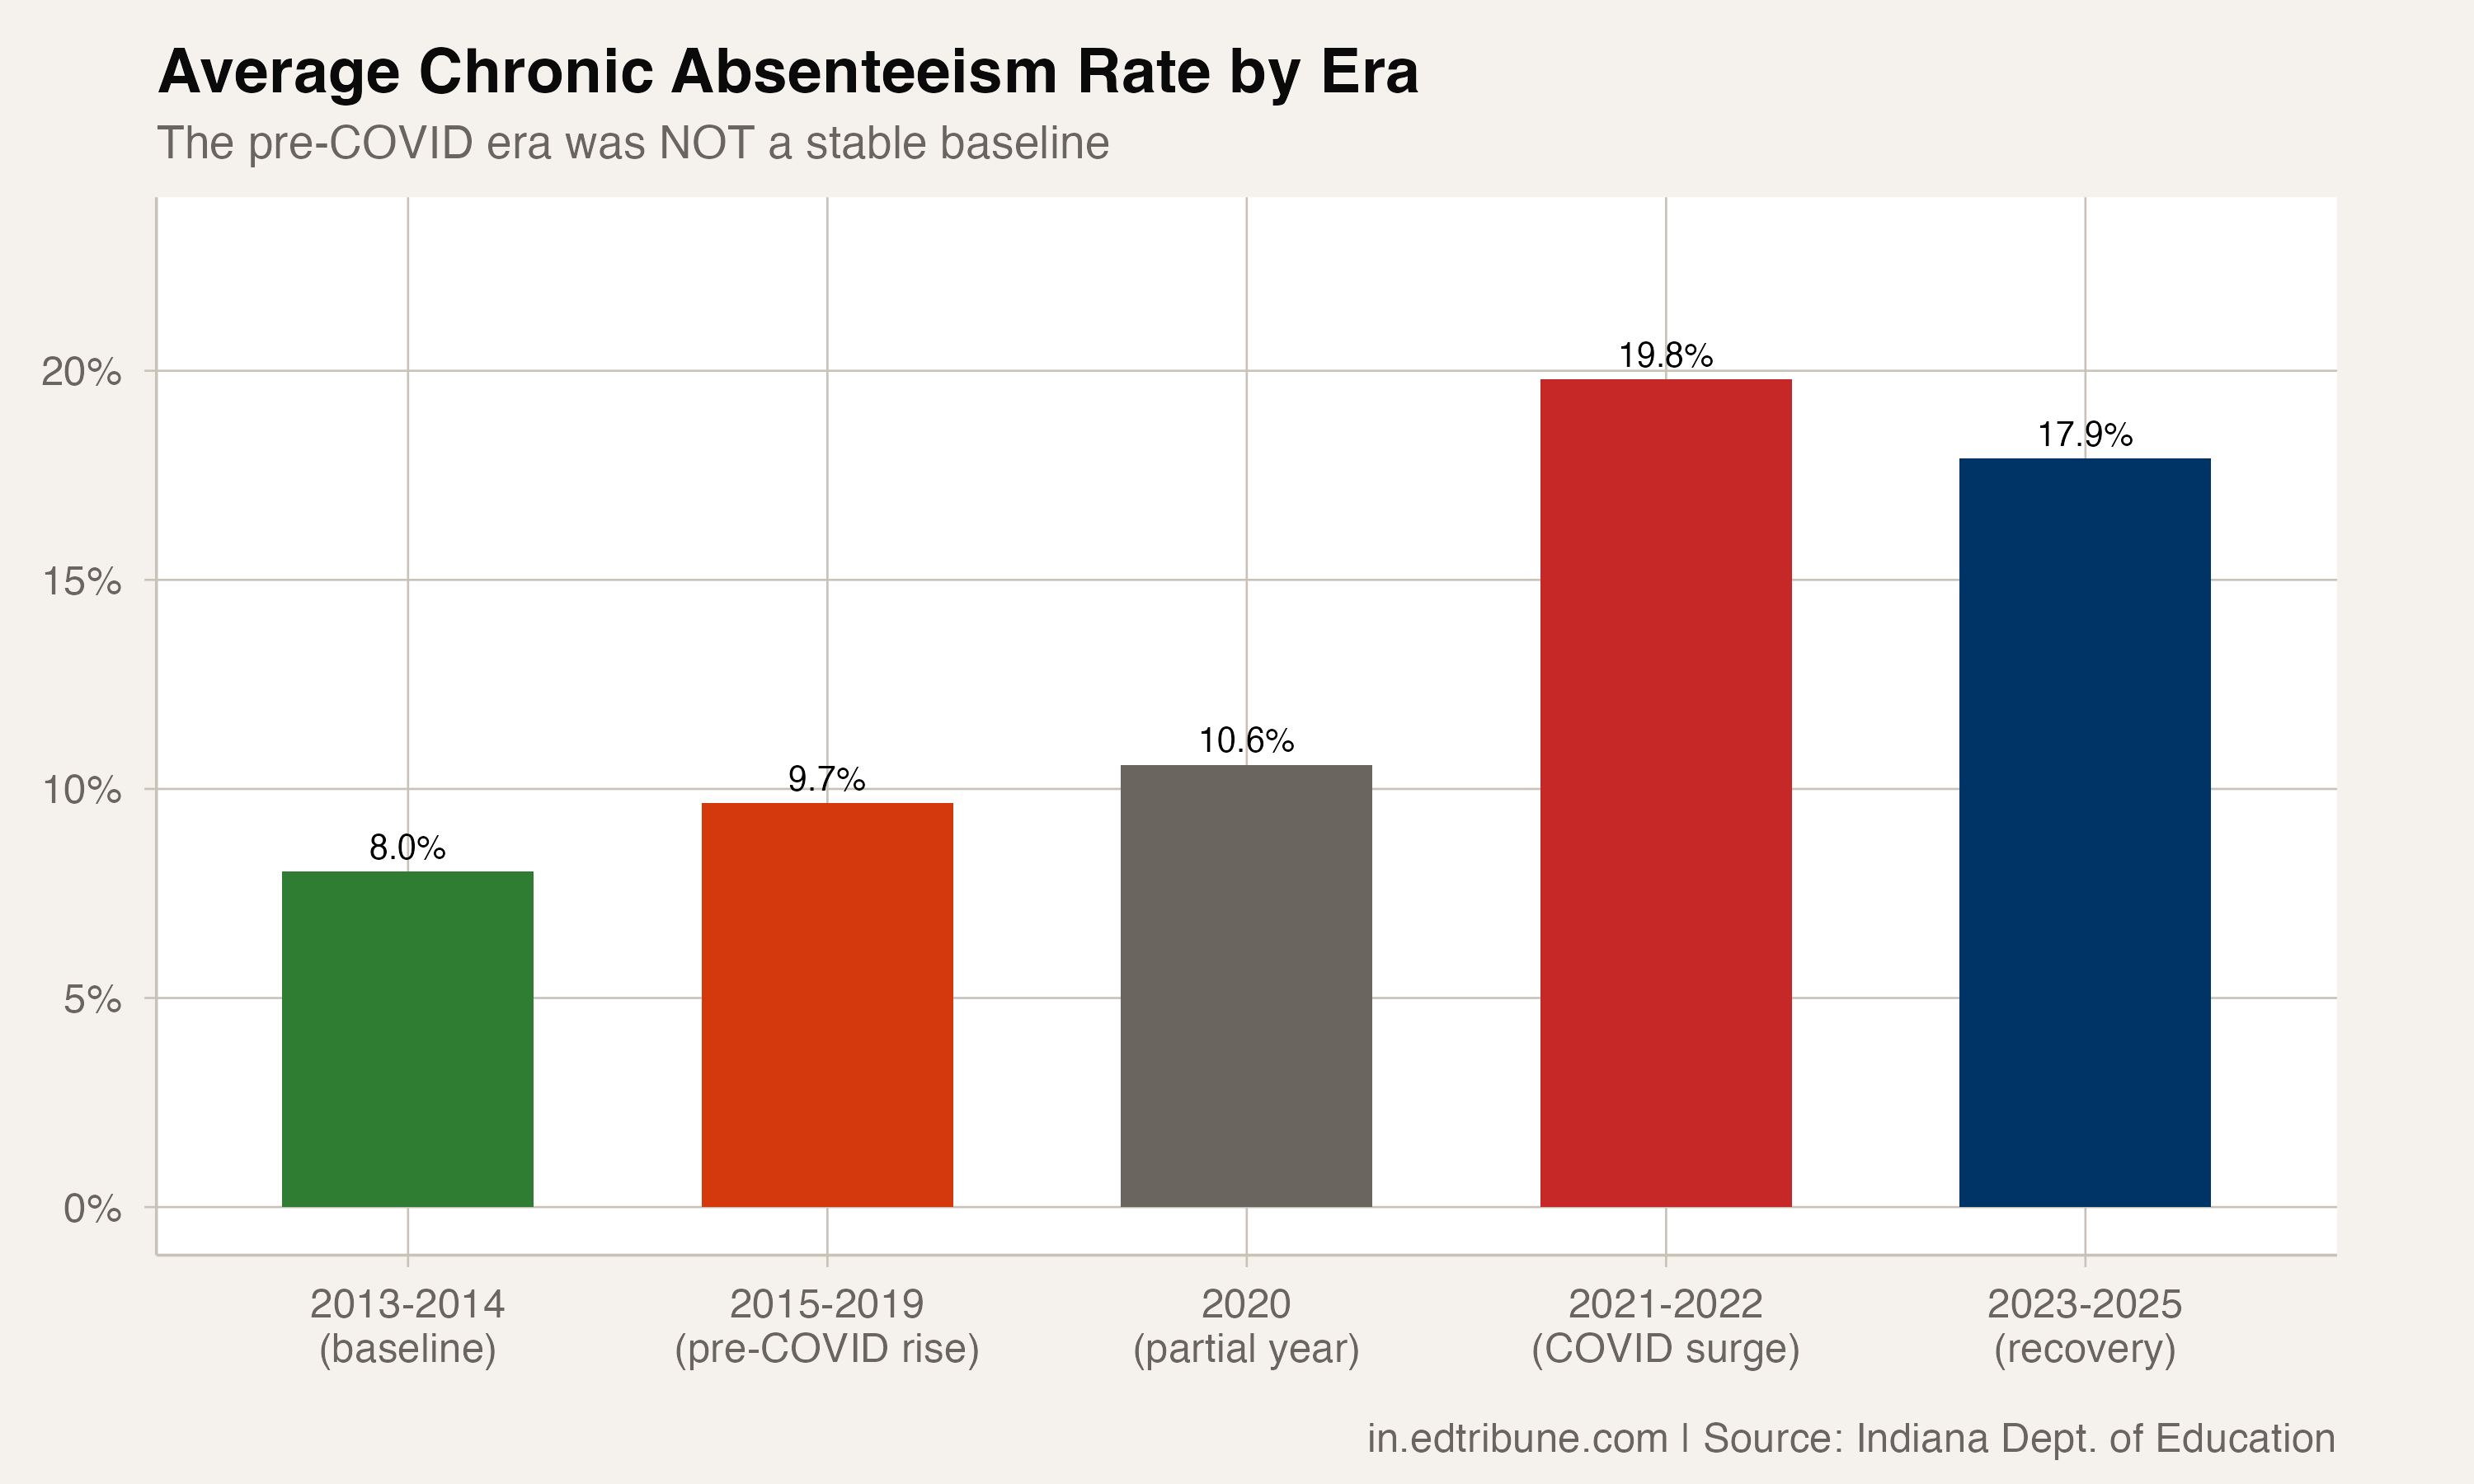
The pre-COVID rise averaged 0.66 percentage points per year between 2015 and 2019. That pace was modest compared to the COVID surge, when the rate jumped 7.91 points in a single year between 2020 and 2021. But the directionality matters. The pandemic did not create Indiana's attendance problem. It built on a problem that was already growing.
What was driving the pre-COVID rise
The data available from IDOE does not include demographic breakdowns by race, income, or special population status, making it impossible to determine from this data alone which student groups drove the pre-2020 increase. But the state-level pattern suggests system-wide factors rather than localized ones. When a rate rises every year for five consecutive years across hundreds of school corporations, the explanation is more likely structural than anecdotal.
National research has identified several candidates. They include the rising prevalence of adolescent mental health challenges, particularly anxiety and depression, along with increasing economic instability among working families, the opioid crisis, and a gradual erosion of social norms around consistent school attendance. Indiana, where 91 of 92 counties have mental health provider shortages and nearly half of high schoolers report symptoms of depression, was exposed to all of these trends.
The 2020 anomaly
One year breaks the pattern. In 2020, Indiana's chronic absenteeism rate actually fell to 10.58%, below the 2019 level. This is counterintuitive. COVID arrived in spring 2020, schools closed, and learning went remote.
The explanation is likely mechanical rather than genuine. Many states relaxed attendance accounting during the pandemic's initial months, and shortened school years reduced the denominator against which absences were measured. The 2020 figure looks like an artifact of disrupted reporting, not evidence that the pandemic initially improved attendance. By 2021, when full-year data was collected under more consistent rules, the rate had nearly doubled to 18.49%.
What this means for recovery targets
If the pre-COVID trend was upward, then a successful recovery should not simply aim to return to 2019's 11.18%. A more appropriate target might be the 2013-2014 average of 8.04%, the last period when Indiana's chronic absenteeism was stable rather than worsening. That would require closing a gap of 8.71 percentage points from the current 16.75%, not the 5.57 points needed to match 2019.
The distinction matters for policy. Indiana's new intervention laws, SB 282 and SEA 482, set intervention triggers but do not establish a statewide chronic absenteeism target. Without one, the implicit goal becomes "return to pre-COVID." The data suggests that pre-COVID was already a problem.
Indiana improved its chronic absenteeism rate for three straight years after the 2022 peak. Whether the goal is 11% or 8%, the current pace of roughly one percentage point per year means the state is years from either benchmark. The pandemic made the problem dramatically worse. But it did not start it. Any solution that treats COVID as the sole cause will miss the forces that were pushing attendance in the wrong direction long before March 2020.
Detailed code that reproduces the analysis and figures in this article is available exclusively to EdTribune subscribers.
Discussion
Sign in to join the discussion.
Loading comments...